• Skip to main content
  • Skip to primary sidebar

SpotGamma™

S&P 500 Stock Market Gamma Trading Levels Based on Options Open Interest

  • About
  • Pricing
  • Academy
  • Resources
    • Tool Demos
    • Case Studies
    • Blog
    • Support Center
    • Daily Report
    • Free Trading Tools
      • Opening Setup Free Report
      • Options Profit Calculator
      • SPX Gamma Exposure
      • Implied Earnings Moves
    • Report Card
  • Login

Market Analysis

Nov 02 2022

Term Structure Ahead of the FOMC

SPX Term Structure Ahead of FOMC

Written by SpotGamma · Categorized: Market Analysis · Tagged: term structure

Oct 30 2022

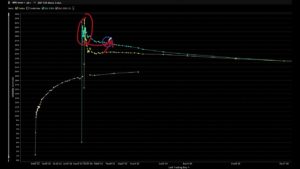
Finding Bottoms in META & AMZN Using Equity Hub
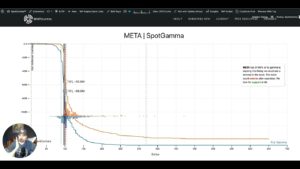
Finding Bottoms in META with Options

SpotGamma uses options data to find potential trading bottoms in META & AMZN after dismal earnings reports from the tech heavyweights.

Written by SpotGamma · Categorized: Market Analysis

Oct 19 2022

Trade Analysis: ES Futures (September 19, 2022, Post-Expiration Monday)
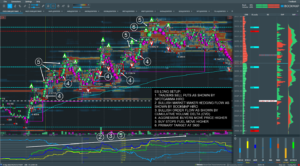
ES Long Setup HIRO Indicator September OPEX Doug Pless

The following is a guest post from Doug Pless. Preparation When I plan to trade futures, I begin my morning preparation by reading the SpotGamma AM Founder’s Note. For ES futures, I note key Gamma levels for SPX and SPY, the SpotGamma Imp. 1 Day Move for SPX, the SpotGamma Gamma Index and Gamma Notional […]

Written by SpotGamma · Categorized: Guest Post, Market Analysis · Tagged: Doug Pless, Equity Hub, ES futures, HIRO Indicator, OPEX

Oct 18 2022

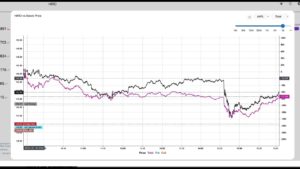
HIRO Can Help Find Stock Lows

HIRO Indicator can help find stock lows

Today AAPL stock cratered after announcing a cut in iPhone 14 production. Options flow may have helped traders identify the stock low – we walk you through how.

Written by SpotGamma · Categorized: HIRO, Market Analysis · Tagged: AAPL

Oct 17 2022

Founders Note for: 2022-10-17 06:58 EDT
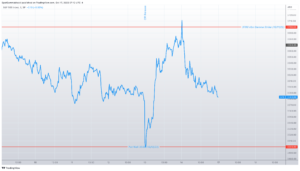
A 5-minute S&P 500 line chart displays prices with CPI Release, 3700 Abs Gamma Strike and 3500 Put Wall annotations.

Macro Theme: Key Levels: –> Range Into October OPEX (10/21):      Top: 3750       Bottom: 3500 Put Wall–> 10/13 CPI likely triggers a multi-day directional trend to 10/21 OPEX Ref Price: 3585SG Implied 1-Day Move: 1.3%SG Implied 5-Day Move: 3.03%Volatility Trigger: 3750Absolute Gamma Strike: 3700Call Wall: 3835Put Wall: 3500 Daily Note: Futures have recovered from Fridays close to 3640. […]

Written by SpotGamma · Categorized: Market Analysis

Oct 12 2022

HIRO Updated Algo Logic & New Features
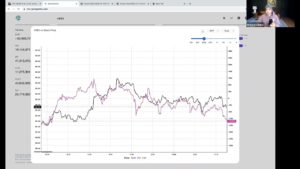
HIRO Indicator new features webinar october 2022

HIRO Webinar 10/11/22  [00:00:00] What we’re here to do today is to discuss some of the changes that we’ve made in Hero. Whether we launched last Friday, and just talk about what those changes are and how you may, may be able to take advantage of those. So the basic dashboard obviously looks the same […]

Written by SpotGamma · Categorized: Market Analysis · Tagged: HIRO

Oct 04 2022

2022: The Year of The Put & Why It Matters

A red inverted triangle graphic shows YEAR OF THE PUT 2022 in dark red letters on a beige background.

Written by SpotGamma · Categorized: Market Analysis

Sep 30 2022

Measuring Skew, Volatility & Tail Risk With Scott Nations
Large red text displaying Volatility Skew and Tail Risk with Scott Nations, founder of Nations Indexes, and SpotGamma logo.

With huge levels of volatility in markets, Brent Kochuba, Founder of SpotGamma, spoke with Scott Nations, Founder, Nations Indexes about their options indexes. Brent & Scott discuss these innovative options metrics including: NOTE: Below is a searchable transcript of the discussion, with timestamps. As its an automated transcript, please forgive any grammatical errors. Nations Index […]

Written by SpotGamma · Categorized: Market Analysis · Tagged: nasdaq, Nations Index, SDEX, TDEX, VOLI

Sep 25 2022

Record Put Buying? Yes, But Record Put Selling, Too.
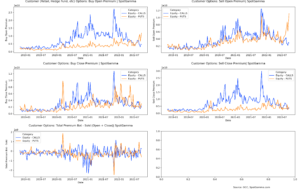
Customer (All Transaction Sizes) Equity Options Activity

There are some charts being passed around that show record equity put buying. While this is correct, it ignores the fact that there is also record put selling. We break down the source of this OCC options data, and what insights it may offer. Note that SpotGamma subscribers have access to this interactive data, free, […]
Written by SpotGamma · Categorized: Market Analysis · Tagged: OCC

Sep 19 2022

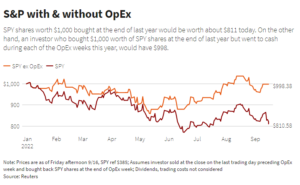
How Options Expiration Impacts Stock Markets

S&P 500 with and without OpEx

Written by SpotGamma · Categorized: Market Analysis

  • « Go to Previous Page
  • Go to page 1
  • Interim pages omitted …
  • Go to page 26
  • Go to page 27
  • Go to page 28
  • Go to page 29
  • Go to page 30
  • Interim pages omitted …
  • Go to page 71
  • Go to Next Page »

Primary Sidebar

SpotGamma-Subscriber-Signup-Banner

  • Hedges Rolled Down, Not Off: Brent Kochuba on Excess Returns
  • The Volatility Trap: What Options Markets Reveal About the Next Two Weeks
  • Tech Vol Collapsed, Put Skew Held Rich: Options Action Live on CNBC
  • Gamma Guy: The 0DTE Flow That Usually Pins the Index Didn’t Arrive
  • AMD Earnings Preview: Can AI Growth Overcome Rising Volatility and Expectations?
  • youtube
  • x
  • Privacy Policy
  • Disclaimer
  • Terms & Conditions
  • Support Center
  • Media
  • Contact Us

©2026 TenTen Capital LLC DBA SpotGamma

All SpotGamma materials, information, and presentations are for educational purposes only and should not be considered specific investment advice nor recommendations. Futures, foreign currency and options trading contains substantial risk and is not for every investor. An investor could potentially lose all or more than the initial investment. Risk capital is money that can be lost without jeopardizing one's financial security or lifestyle. Only risk capital should be used for trading and only those with sufficient risk capital should consider trading. Past performance is not necessarily indicative of future results. Testimonials appearing on this website may not be representative of other clients or customers and is not a guarantee of future performance or success.

View Full Risk Disclosure