Using Options to Evaluate Rate-Sensitive Names
With last week bringing realized volatility to the highest levels seen in 6 months, the market has entered a highly reactive state. Market events and data releases each have the potential to change the outlook for direction and volatility—and the December 10 FOMC remains the biggest date on the macro calendar in 2025.
Following the last FOMC meeting on October 29, Powell’s hawkish tone led to a multi-week equities slide. With another key FOMC approaching, traders are narrowing in on one major question: What will the Fed do next?
The options market is inherently forward-looking, which means volatility pricing should account for the likelihood of outcomes for known future events. Traders can therefore use volatility term structure, skew analysis, and flow-based positioning to evaluate how rate-driven names may be impacted and how to prepare for the December FOMC.
December’s Rate Cut: Are Traders Prepared?
According to the CME FedWatch Tool, Fed Funds Futures now price in an 80% probability of a 25 bps rate cut at the December 10 FOMC—a sharp rise from last week’s 50% level. Combined with the Fed’s scheduled end of Quantitative Tightening (QT) on December 1, macro conditions appear supportive for equities into year-end.
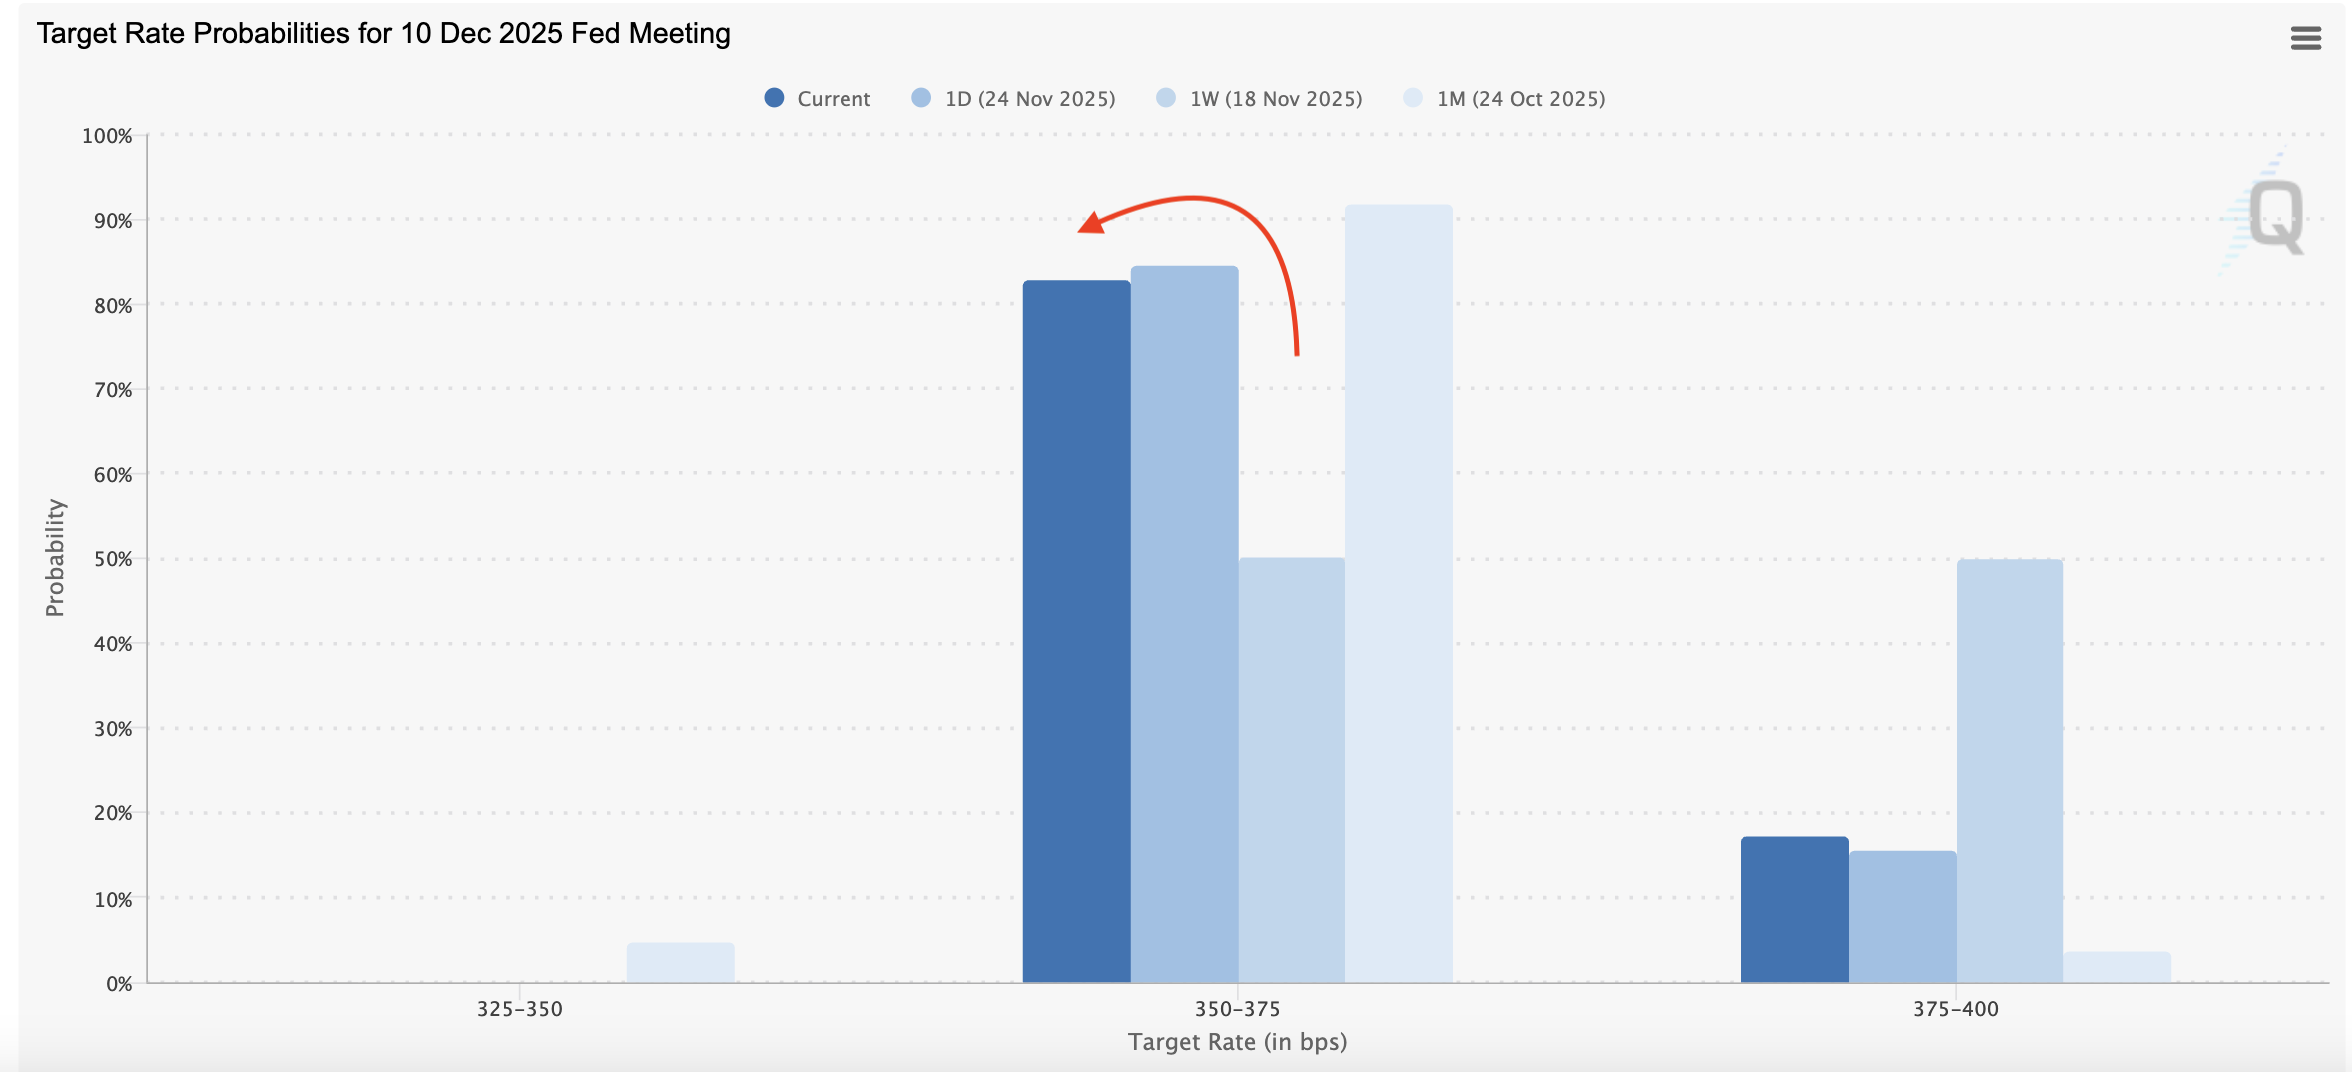
This change in tune seems to have created a strong tailwind for the stock market. Vol has come down slightly in recent days, and the equities selloff and turned around as markets head into the Thanksgiving holiday.
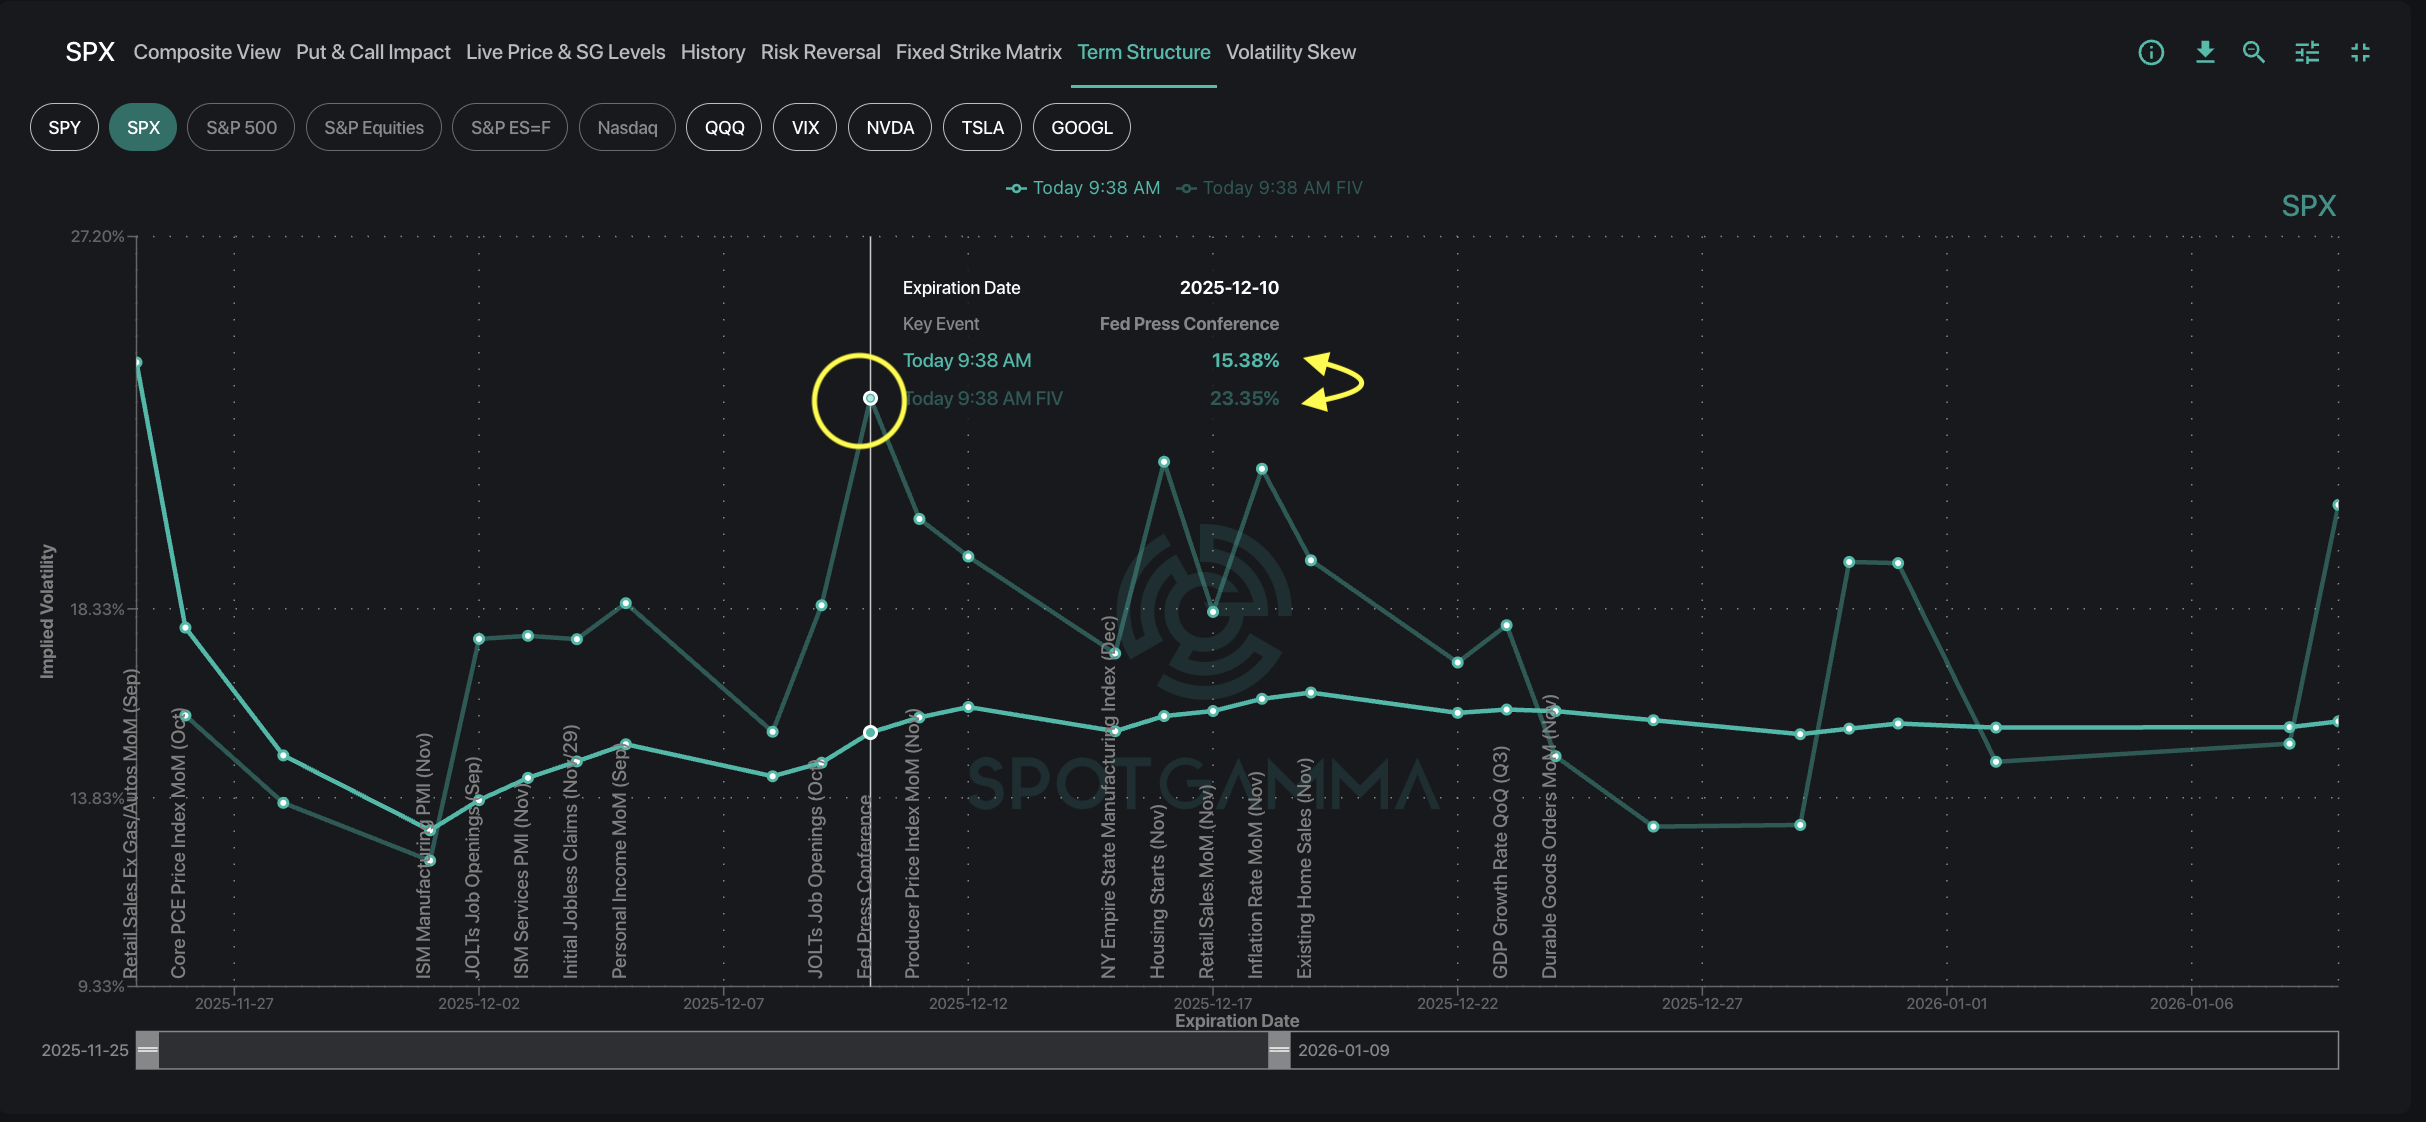
SpotGamma’s Term Structure shows that despite a relatively low implied volatility (IV) of 15.5% for December 10. However, using forward-adjusted IV for the same date spikes IV to 23%. This large spread indicates potential jump risk associated with FOMC. Heightened Forward IV also means traders may not have accurately priced in the rate cut expectations, making the IV – and options prices for that expiration – relatively cheap.
Heavy Put Buying in IWM and Rate-Sensitive Sectors
Taking a look at rate-sensitive sectors reveals just how impactful December’s FOMC truly could be. While a surprise FOMC would almost assuredly impact the entire market, the ETFs most impacted most by rate change include IWM (Russel 2000), KRE (regional banking), and XHB (homebuilders). Bond ETFs and real estate stocks would likely be affected, as would alternative asset classes like crypto (IBIT, ETHA) and medals (GLD, SLV).
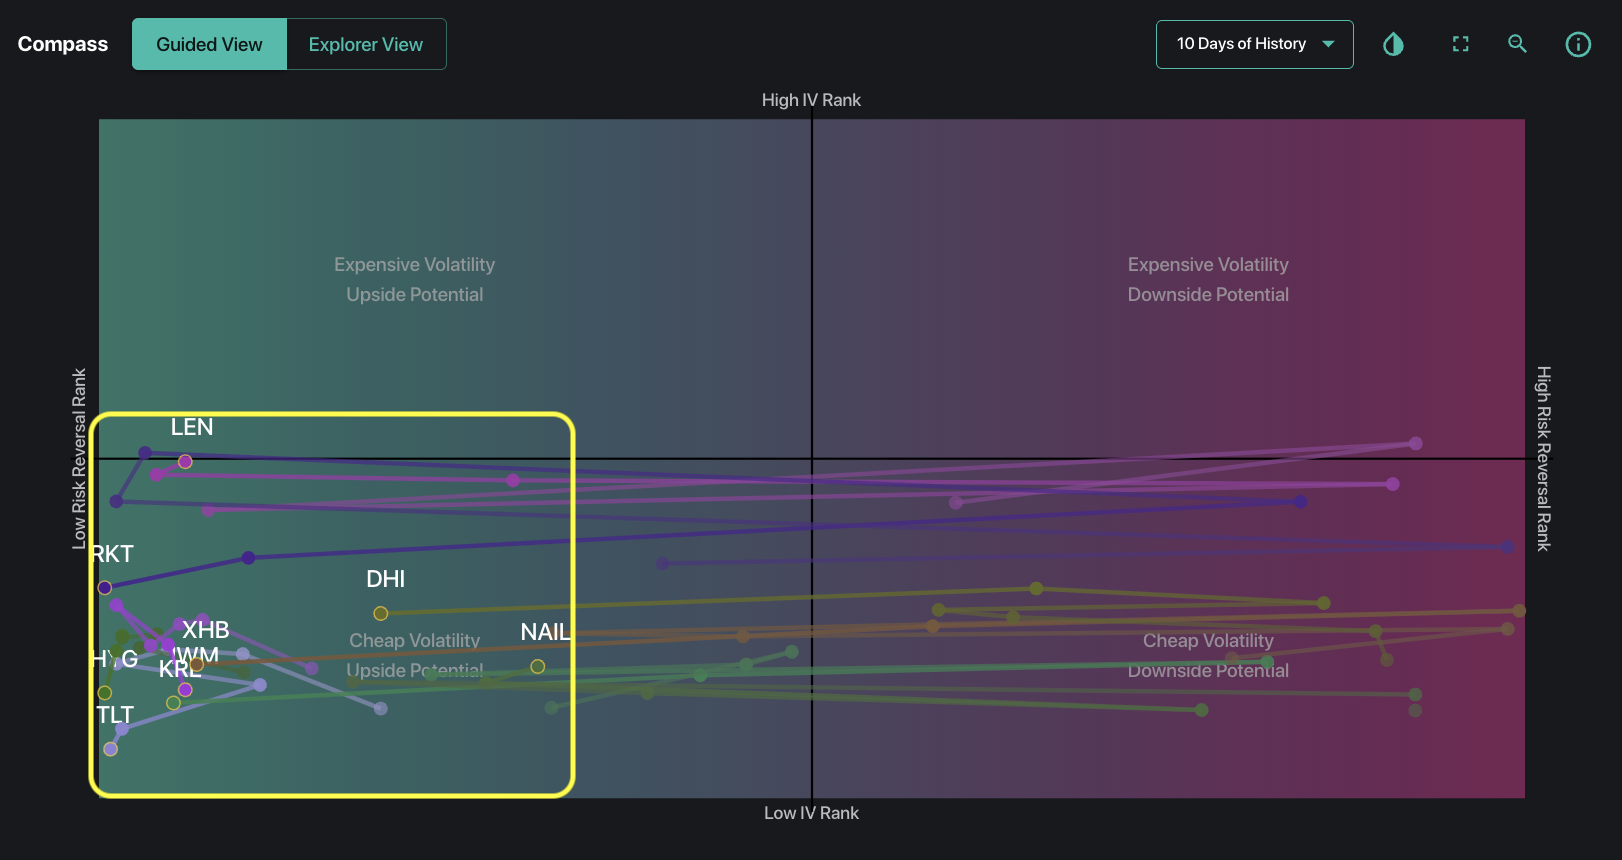
SpotGamma’s Compass compares IV Rank and Risk Reversal Rank of the targeted names to screen for where the market is pricing in changes to direction or volatility. Screening for rate-sensitive names reveals a move towards the bottom left quadrant, indicating heightened put demand vs. call demand.
Several names specifically stand out to us here. IWM has 94th percentile put skew, while names like TLT and HYG have put skew of 99th percentile—traders have bid up puts in these names dramatically in the past two weeks.
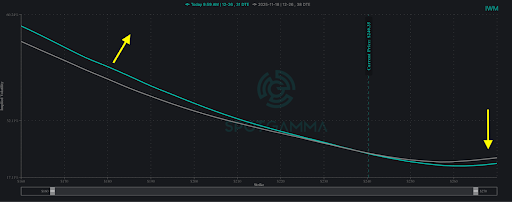
Looking at volatility skew, IWM in particular stands out noticeably compared with the curve one week ago (November 18). The put wing has steepened while the call skew flatlined, indicating growing bearish sentiment despite the growing likelihood of a rate cut.
The IWM Trade: Bracing for Downside Despite Bullish Macro
Looking at the gamma profile of IWM, the ETF is currently trading amidst a negative gamma environment. This means fluid price action is to be expected as market makers trade with price action.
The current IWM price of ~241 has some stability as it sits above its Hedge Wall of 240. To the upside, the 250 Call Wall has some resistance worth monitoring, and to the downside we see a wide range of negative gamma strikes.
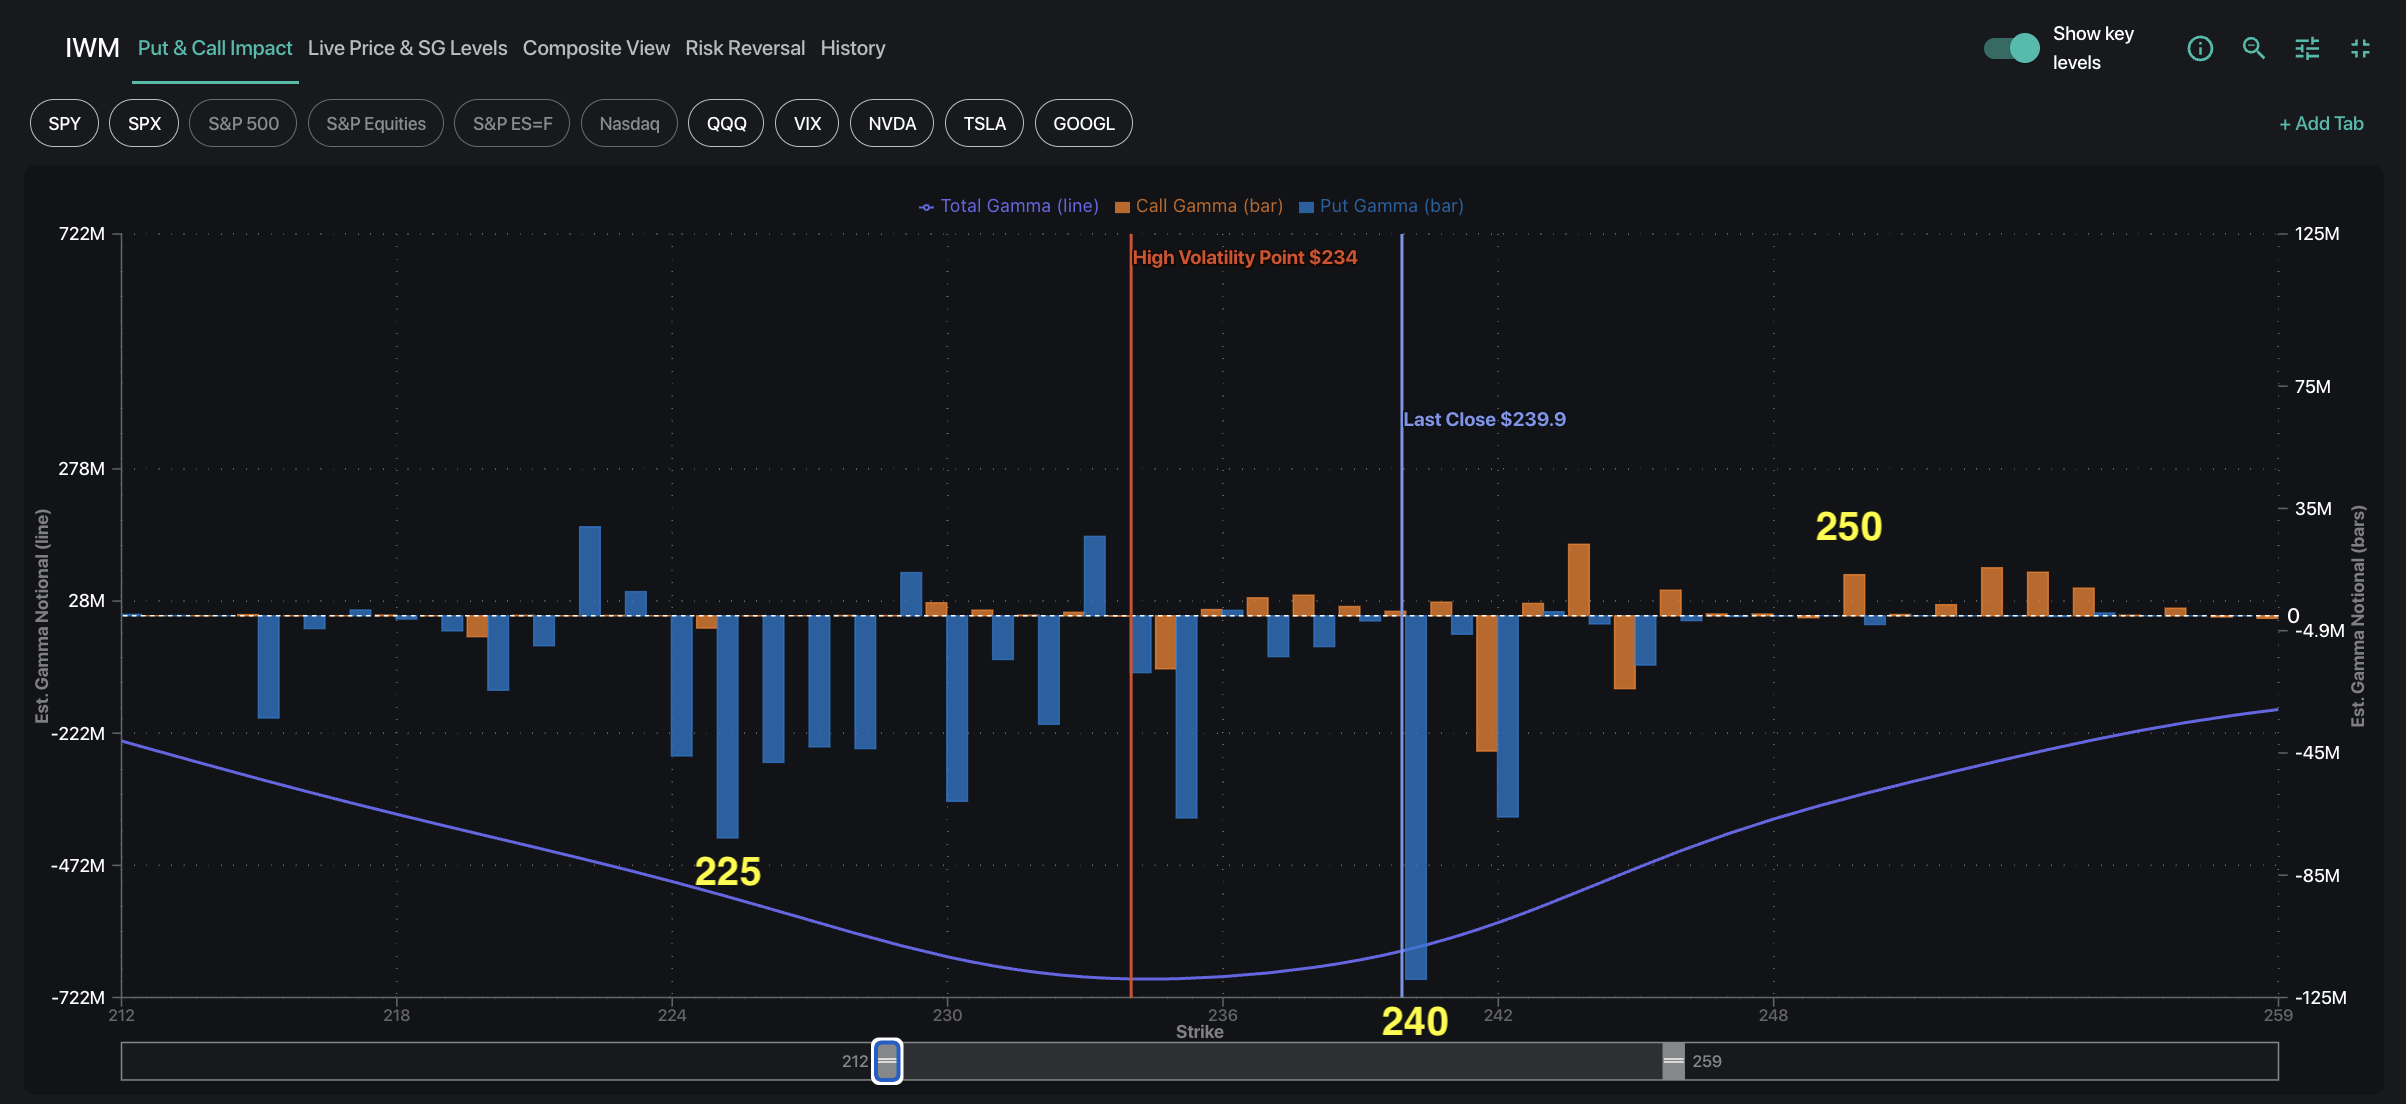
Why does this downside negative gamma concern us? As traders bought puts heavily in the 225 to 240 zone, market makers are therefore short puts in this range. That means if price drops meaningfully below 240, dealers would have to sell stocks to hedge their positions. This could accelerate the downside drop, igniting a bearish feedback loop.
A solid break above the 240 level would force market makers to cover their short position by buying back stock. Regardless of direction, market maker’s hedging flow would be amplifying price movement.
Despite the put skew of IWM and other rate-sensitive names, we saw some unusual order flow in our FlowPatrol report this morning. One of the largest ETF positioning changes was a 58k-lot IWM put expiring in December. This contract was rolled from 224 to 228, indicating traders maintaining downside hedges.

What This Means for Traders into December FOMC
With the high probability of a Fed rate cut in December, the put buying of rate-sensitive tickers remains interesting and worth paying attention to. Given that traders may be overly hedged to the downside for names such as IWM, calls or call spreads may be the best way to capitalize on cheap upside premium. However, the heightened Forward IV means that traders must also consider the downside risk associated with the December 10 FOMC—despite the current 80% probability of a rate cut.
There are several ways traders can stay informed in the event of a rate cut. First, watching how volatility skew evolves for IWM and other rate-sensitive names can show whether the put-heavy positioning continues or begins to reverse. Second, watching open interest to gauge the size of positions traders are drawing up for these names. Third, monitor unusual order flow to see if this points to major shifts in positioning—SpotGamma’s FlowPatrol may be particularly helpful in this respect.
As Benjamin Graham said, “In the short run, the market is a voting machine but in the long run, it is a weighing machine.” The next two weeks will tell just how much weight IWM’s put-heavy positioning carries, and whether the volatility skew remains imbalanced as FOMC draws near.
Want These Insights Ahead of Each Trading Day?
SpotGamma provides both pre-market insights and real-time analytics designed to help you optimize your trades and protect your PnL. This week only, get 75% off your first month of SpotGamma Alpha — only available for a limited time.