• Skip to main content
  • Skip to primary sidebar

SpotGamma™

S&P 500 Stock Market Gamma Trading Levels Based on Options Open Interest

  • About
  • Pricing
  • Academy
  • Resources
    • Tool Demos
    • Case Studies
    • Blog
    • Support Center
    • Free Daily Report
    • Free Trading Tools
      • Options Profit Calculator
      • SPX Gamma Exposure
      • Implied Earnings Moves
      • Volatility Ranking
    • Free Training
    • Report Card
  • Login

Oct 30 2019

Fed Versus High Gamma

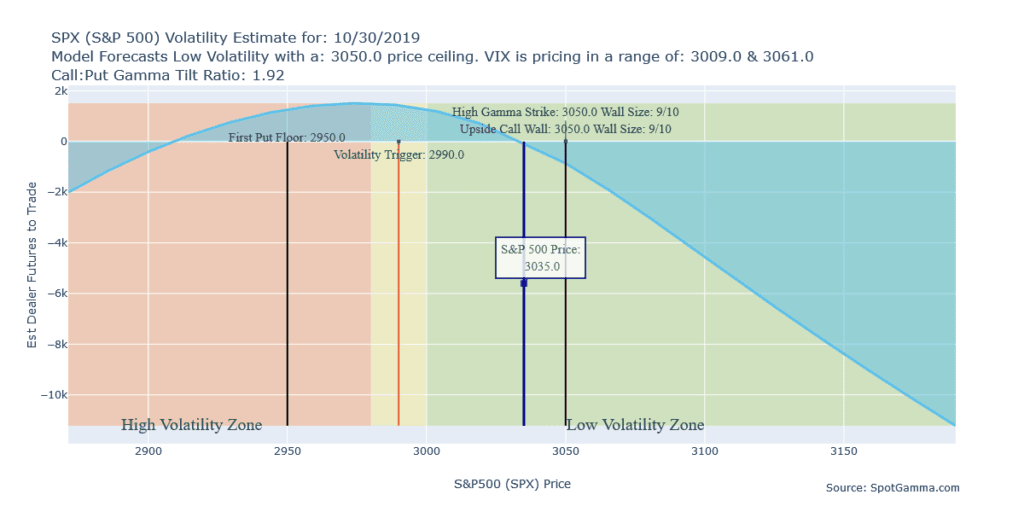
Today we have an interesting confluence of events: a FED FOMC rate day and ultra high S&P500 market gamma. As of this posting( 10/30 @ 10:30 AM EST) market gamma is ~$1.8 billion which is quite high and forecasts an S&P500 trading range of 50 bps (1/2%). The Fed is widely expected to cut rates today with market pricing a 99.5% chance of 25 bps cut.

Assuming he sticks to expectations we would anticipate implied volatility to drop and we might test the 3050 level in SPX. That is our high gamma strike and has ~$9 billion of gamma associated with it – we believe this provides quite a resistance wall. It will be very interesting to see if that holds true.

Additionally because gamma is so high any selling could mean revert due to that high market gamma.
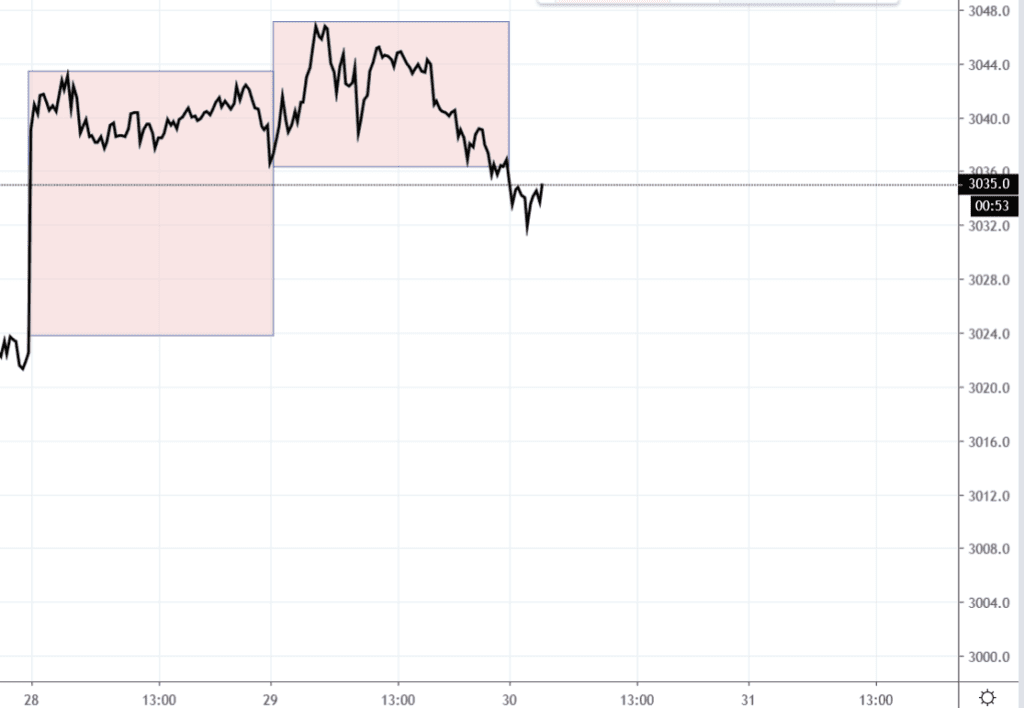
SPX Chart Pre Fed

Pre-Fed gamma snapshot:

Closing Update – the 3050 wall held for today with a slightly larger SPX trading range than anticipated today. Gamma had priced a ~15 handle move and the actual range was a bit closer to 20.
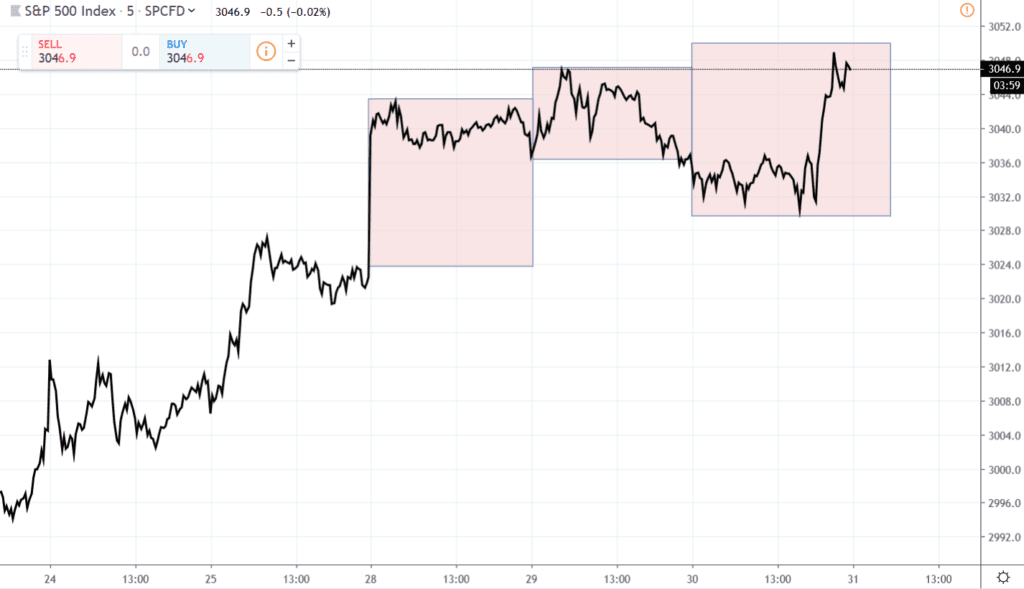
10/23/19 SPX closing chart

Once again the VIX is the market tell, forecasting the move up in SPX.
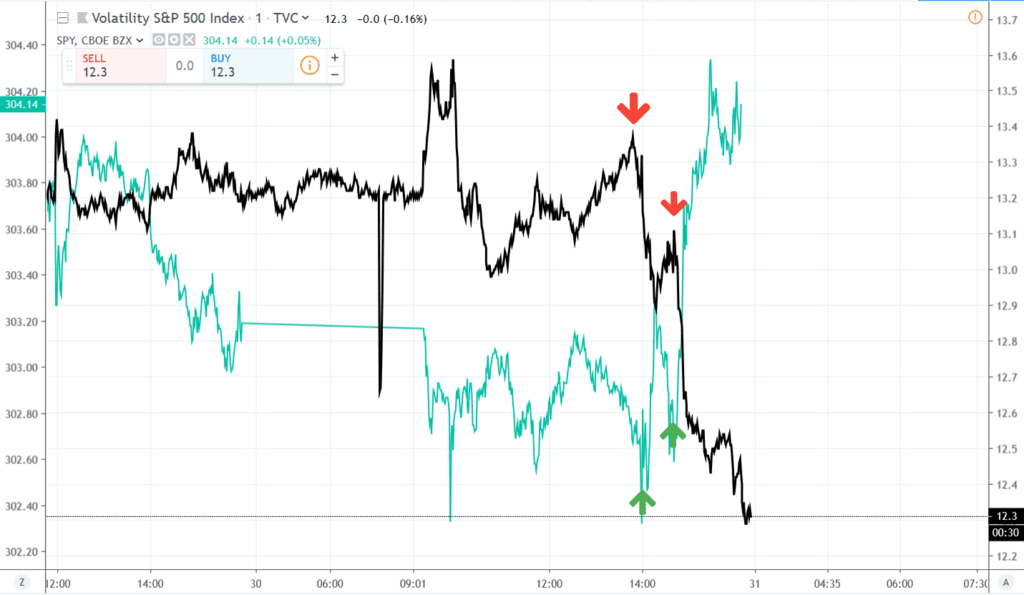
SPX VIX vs Fed Move

Share This Article

  • Share
  • Twitter
  • LinkedIn
  • Reddit
  • Facebook

Written by SpotGamma · Categorized: Market Analysis · Tagged: FED, high gamma, rate cut

Don’t have an account with SpotGamma?

Choose the plan you want today to view unique support and resistance levels, access Founder’s Notes and expert commentary, daily trading ranges, and entrance into our private Discord.


Primary Sidebar

Related Resources

  • NVDA Earnings: The Options Market May Be Underpricing This Move

    NVDA Earnings: The Options Market May Be Underpricing This Move

    August 25, 2026
  • Volatility Has Compressed. What Happens Next?

    Volatility Has Compressed. What Happens Next?

    August 23, 2026
  • Another SpaceX Unlock, and Why $150 Still Caps the Stock

    Another SpaceX Unlock, and Why $150 Still Caps the Stock

    August 20, 2026
  • Options Exchange Monitor — Week of August 15, 2026 (36 SEC notices, 2 CFTC, 0 EDGAR)

    Options Exchange Monitor — Week of August 15, 2026 (36 SEC notices, 2 CFTC, 0 EDGAR)

    August 17, 2026
  • GEX Levels for SPY, QQQ, ES and NQ: Using Index Gamma in Any Product

    GEX Levels for SPY, QQQ, ES and NQ: Using Index Gamma in Any Product

    August 17, 2026
  • youtube
  • x
  • Privacy Policy
  • Disclaimer
  • Terms & Conditions
  • Support Center
  • Media
  • Contact Us

©2026 TenTen Capital LLC DBA SpotGamma

All SpotGamma materials, information, and presentations are for educational purposes only and should not be considered specific investment advice nor recommendations. Futures, foreign currency and options trading contains substantial risk and is not for every investor. An investor could potentially lose all or more than the initial investment. Risk capital is money that can be lost without jeopardizing one's financial security or lifestyle. Only risk capital should be used for trading and only those with sufficient risk capital should consider trading. Past performance is not necessarily indicative of future results. Testimonials appearing on this website may not be representative of other clients or customers and is not a guarantee of future performance or success.

View Full Risk Disclosure