One of the most profitable setups in options-land is the GEX Flip—the moment a market transitions from a stable, “pinned” environment into a high-volatility “squeeze” or “slide.” Using the TRACE charts from April 23, 2026, we can see exactly how this transition occurs in real-time.
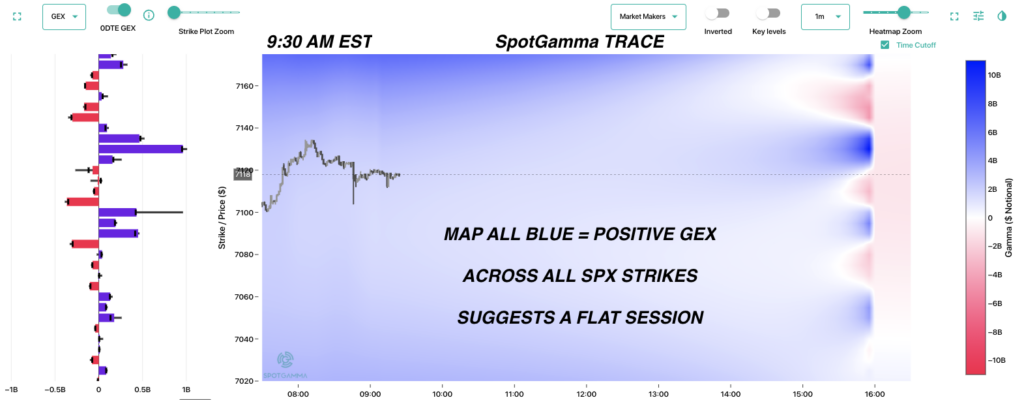
Stage 1: The Stable Open (9:30 AM EST)
At the open, the TRACE map is all blue.
The Signal: Large Positive GEX across all SPX strikes.
The Trade: In this regime, market makers are “long gamma.” They buy dips and sell rallies to remain delta-neutral. This creates a gravitational “pin” that suppresses volatility. Traders should expect a flat, range-bound session.
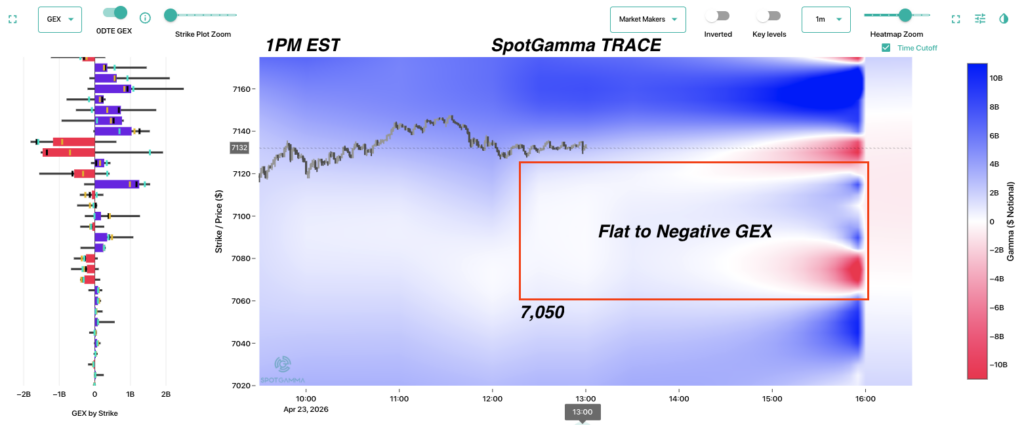
Stage 2: The Pocket Forms (1:00 PM EST)
By mid-day, the map begins to shift. While the top remains blue, a “Flat to Negative GEX” pocket begins to open up below the current price, specifically around the 7,050 strike.
The Signal: White/Red pockets appearing on the heatmap.
The Warning: The market is losing its supportive floor. If a catalyst hits, there is no “gamma buffer” to slow the descent.
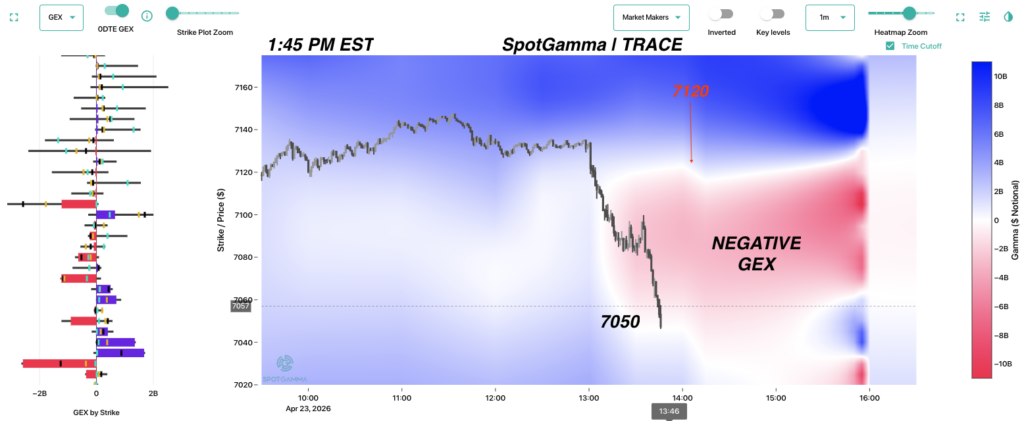
Stage 3: The Headline Slide (1:45 PM EST)
A sudden headline triggers a sell-off. Because the market just moved into that Negative GEX pocket, market makers must now flip their behavior.
The Signal: Price slices through the “white zone” into the red.
The Mechanic: In negative gamma, dealers must sell into weakness to hedge. This accelerates the move. Notice how the SPX moves exactly through the red pocket until it hits the 7,050 support level, where positive gamma (blue) still exists.
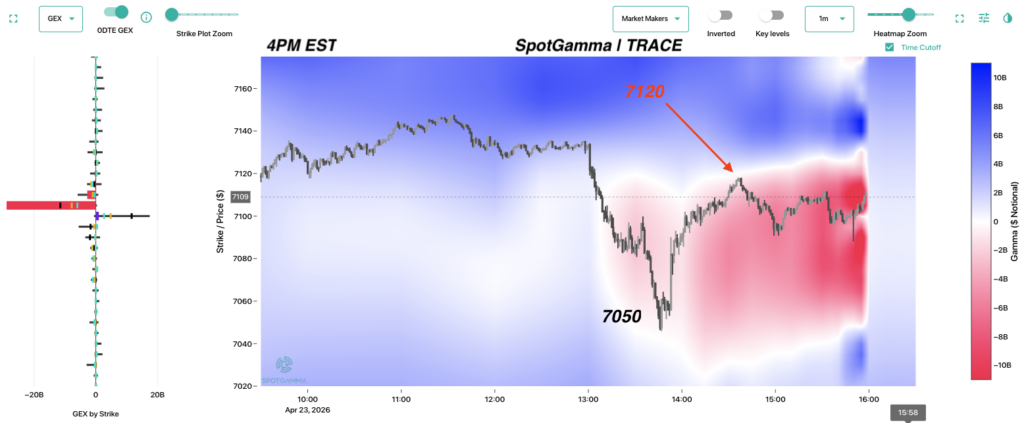
Stage 4: The Rip Back to Equilibrium (4:00 PM EST)
Once the 7,050 floor holds, the “oversold” snap-back occurs.
The Result: The market rips higher, fueled by short-covering, and heads directly back to the 7,120 level—exactly where the overhead positive gamma concentration had formed earlier in the day.
The “GEX Flip” Trading Checklist
1. Identify the Regime: Is the map solid blue (stable) or are red pockets forming?
2. Find the “Vacuum”: Negative GEX pockets act as volatility vacuums. Price will move through them faster than blue zones.
3. Target the Nodes: Use the Strike Plot (left side of TRACE) to find the largest blue bars. These are your ultimate support and resistance targets for the day.
Want to see these pockets before they break?
