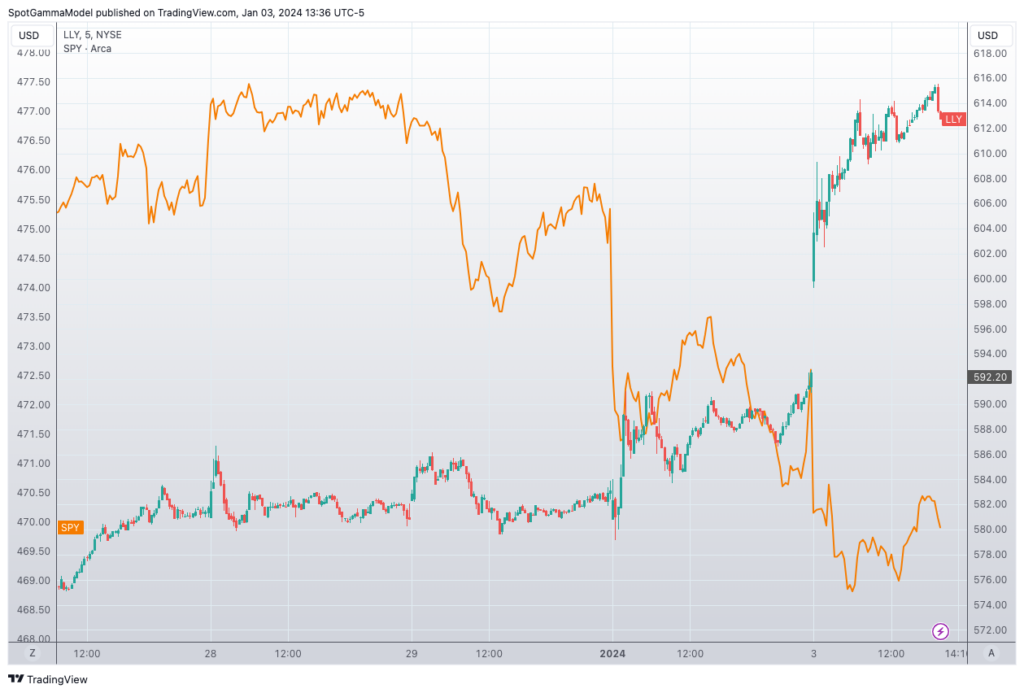
Shares of LLY were +3.5% near $612 today, Wed Jan 3rd, despite broader market weakness (SPY, -0.55% orange). There was no concrete news around the increase in LLY shares, which led us to dive into options flow as a potential driver.
We start with our HIRO indicator, which measures market maker hedging pressure based on proprietary SpotGamma indicators on real time options trading. As traders buy calls and/or sell puts, our HIRO indictor rises, as seen below in purple. If the indicator trends lower, it implies traders are selling calls and/or buying puts.
Further, we offer a HIRO lens which only monitors the next available expiration, often dubbed “0DTE”. This flow is shown in teal.
As you can see, the purple line is trending much higher than the teal line, implying that there are large trader(s) purchasing longer dated calls (or selling longer dated puts), to the tune of +$79mm in LLY.
Additionally, if you look at the bottom of the image below, you can see a gauge called “HIRO Signal” (red box). This gauge shows a small white circle to the right of the gauge, which tells us that todays HIRO signal is the most positive reading we’ve seen over the last 30 days.
The takeaway here is that this is the largest amount of bullish options flow LLY has seen in a month!

How material is this flow to options dealers? Is it enough to spark a larger squeeze?
To gauge longer term sentiment, we turn to our new implied volatility tools.
Shown below is our Fixed Strike Volatility Matrix [FSM], which shows the implied volatility [IV] for every single option in LLY. The expirations are listed along the Y axis, with strikes along the X axis.
As you can see, there is a large block of green around current the LLY price (~$610), and for the 2/9/24 expiration. This brighter green tells us that implied volatility is higher for these strikes into these dates. This can be a signal for traders looking for larger stock movement, but also can be a signal that options exposures are elevated for options dealers/market makers.
For all other strikes and dates, the matrix shows a light shade of red.
This informs us that near term options IV’s are not reacting to today’s higher LLY prices. This, in our opinion, reduces the change of a continued squeeze.

We can look at IV in a different way to investigate the higher, localized IV’s, shown above.
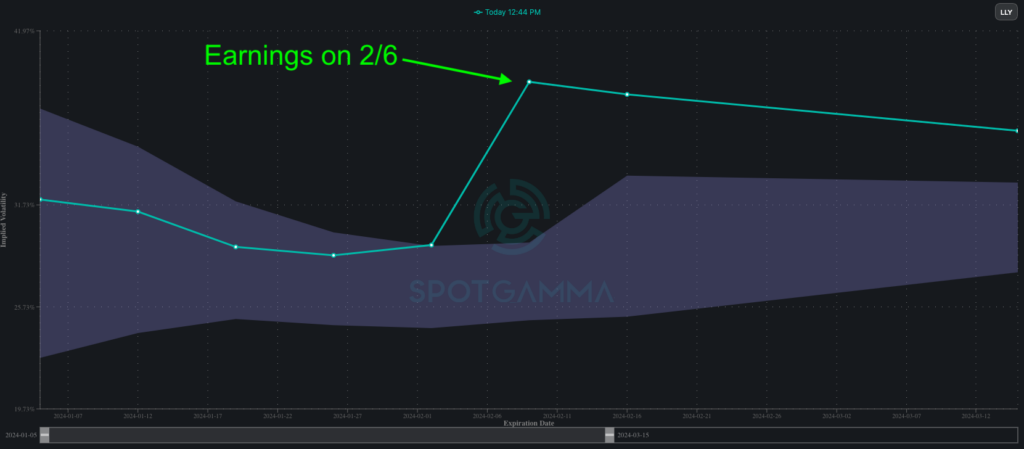
Below is a plot of term structure, which shows at-the-money [ATM] IV for LLY. You can see that near term IV’s are in the middle of their 2 month historical range (the shaded cone), however IV’s spike starting on 2/6. A spike in the term structure, or an isolated block of green as shown in the FSM above, is often a signal of an event, like an earnings date.
This is exactly what we find in the case of LLY, which as earnings on 2/6. Therefore every expiration after 2/6 is pricing in higher levels of volatility, which explains the spike shown below.
This leads us to two conclusions:
- Today’s rise in LLY shares are likely being strongly influenced by some longer term options buyers
- This flow appears isolated to a few large players, and its not indicative of larger options demand. If there was larger sets of options demand it would be reflected in brighter shades of green in the FSM, for near term expirations.
This places the sustainability of the current rally into suspicion, as it suggests that the demand from a small number of sizable players are driving the stock higher. If this large trader(s) backs off, that could lead to mean reversion in LLY share prices.
How could we structure a trade around this?
Because LLY earnings are on 2/6, any option expiring after that date should have a relatively more stable implied volatility than shorter dated, pre-earnings expirations. Therefore, we would generally not want to short LLY options that expire after 2/6, as they may not decay and/or lose value as expected. However, this stabilization may make for an interesting long leg of spread, such as a calendar spread.
We’ll select 2/9 expiration for a long leg.
What about a second leg for our spread?
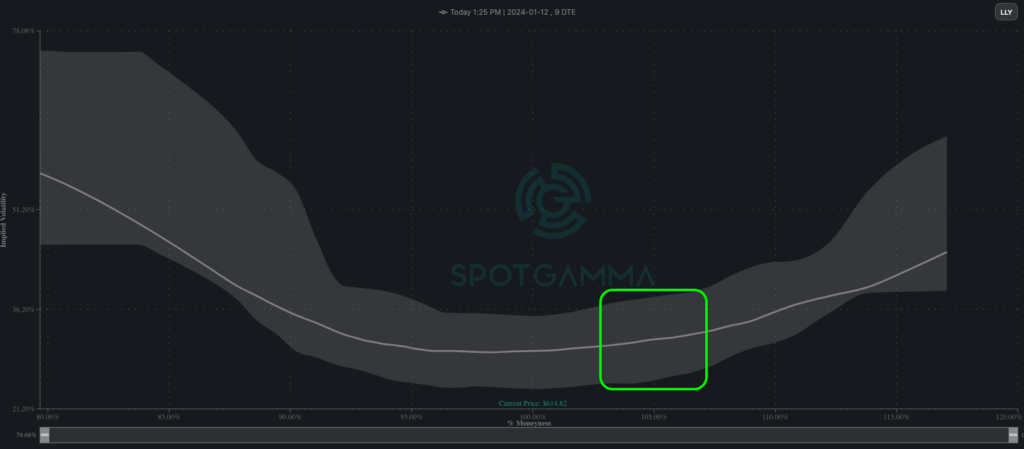
Recall that at the top of this note, our FSM suggested that there were not high IV’s for short dated LLY options. We can further examine this idea by looking at the LLY skew for 1/12 expiration. Here we see that indeed, IV’s for LLY options are pretty average, as is implied by the skew line being in the middle of the grey shaded area. Again, this shaded area represents the 10th-90th percentile range for the given IV’s over the last 2 months.
This “average” IV pricing suggests there is not a whole lot of edge in shorting out of the money LLY calls, wherein we’d try and play a “short volatility” trade.
Therefore, if we want to place a bet on LLY stock mean reverting, we’re going to be betting more on the stock price declining, vs IV declining. This means we’d seek to be in a short delta trade, more-so than a short vega trade.
ATM options have a higher delta than out-of-the-money (OTM) options. Because IV’s are not very elevated, we do not want to short OTM calls. Lastly, because we do not anticipate a massive decline in the stock, we do not want to structure into deep in-the-money (ITM) options.
Let’s consider a calendar spread, shorting the 1/12 exp ATM calls (610) vs buying the 2/9 exp 610 calls for a debit of $18.57. In this situation, if the stock holds, or reverses mildly lower in the next few sessions, the spread should profit as the short dated, 1/12 call starts to lose value faster than the longer dated, post-earnings call.
You can see the PNL projection in the plot below, courtesy of OptionStrat.
