• Skip to main content
  • Skip to primary sidebar

SpotGamma™

S&P 500 Stock Market Gamma Trading Levels Based on Options Open Interest

  • About
  • Pricing
  • Academy
  • Resources
    • Tool Demos
    • Case Studies
    • Blog
    • Support Center
    • Free Daily Report
    • Free Trading Tools
      • Options Profit Calculator
      • SPX Gamma Exposure
      • Implied Earnings Moves
      • Volatility Ranking
    • Free Training
    • Report Card
  • Login

term structure

Sep 03 2026

Doves Fly into August Jobs Report

August Jobs Report Preview As Doves Fly

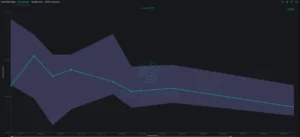
Friday’s 8:30 a.m. ET Employment Situation report has the potential to be the biggest bond-market catalyst since Jackson Hole, yet the options market is pricing a contained move. A look at SPX term structure, fixed strike vol, and dealer gamma ahead of the print.

Written by SpotGamma · Categorized: Market Analysis · Tagged: gamma, GLD, implied volatility, interest rates, jobs report, negative gamma, OPEX, payrolls, term structure

Jan 30 2024

Comparing Earnings IV’s for Edge

AMD post-earnings

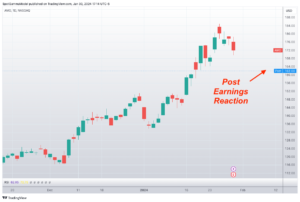
In a recent Member Q&A session SpotGamma discussed how traders can analyze implied volatility and potential stock movements by comparing the relative moves and reaction of stocks in similar sectors. Here we look at the volatility & setup into SMCI’s earnings report, and its subsequent reaction, to guide us on what may happen for AMD […]

Written by SpotGamma · Categorized: Market Analysis · Tagged: earnings, implied volatility, skew, term structure

Jan 03 2024

LLY Using Implied Volatility: a SpotGamma Options Case Study

LLY Implied Volatility

Shares of LLY were +3.5% near $612 today, Wed Jan 3rd, despite broader market weakness (SPY, -0.55% orange). There was no concrete news around the increase in LLY shares, which led us to dive into options flow as a potential driver. We start with our HIRO indicator, which measures market maker hedging pressure based on […]
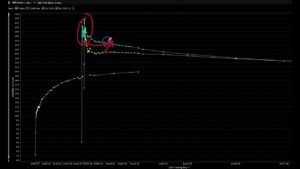
Written by SpotGamma · Categorized: Market Analysis · Tagged: Calendar Spread, fixed strike volatility, options flow, term structure

Nov 02 2022

Term Structure Ahead of the FOMC

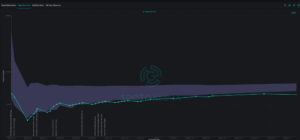
SPX Term Structure Ahead of FOMC

Written by SpotGamma · Categorized: Market Analysis · Tagged: term structure

Primary Sidebar

SpotGamma-Subscriber-Signup-Banner

  • September OPEX Options Positioning: Why 7,600 Is the Line | The OPEX Effect
  • S&P 500 Negative Gamma Below 7,600 — Brent Kochuba on tastylive
  • CPI Is the Catalyst. 7600 Is the Trade.
  • Trade Idea Generation Using Opening Setup
  • Gamma Guy with tastylive: Options Positioning Pins the Index While Tech Names Make Moves
  • youtube
  • x
  • Privacy Policy
  • Disclaimer
  • Terms & Conditions
  • Support Center
  • Media
  • Contact Us

©2026 TenTen Capital LLC DBA SpotGamma

All SpotGamma materials, information, and presentations are for educational purposes only and should not be considered specific investment advice nor recommendations. Futures, foreign currency and options trading contains substantial risk and is not for every investor. An investor could potentially lose all or more than the initial investment. Risk capital is money that can be lost without jeopardizing one's financial security or lifestyle. Only risk capital should be used for trading and only those with sufficient risk capital should consider trading. Past performance is not necessarily indicative of future results. Testimonials appearing on this website may not be representative of other clients or customers and is not a guarantee of future performance or success.

View Full Risk Disclosure