• Skip to main content
  • Skip to primary sidebar

SpotGamma™

S&P 500 Stock Market Gamma Trading Levels Based on Options Open Interest

  • About
  • Pricing
  • Academy
  • Resources
    • Tool Demos
    • Case Studies
    • Blog
    • Support Center
    • Daily Report
    • Free Trading Tools
      • Opening Setup Free Report
      • Options Profit Calculator
      • SPX Gamma Exposure
      • Implied Earnings Moves
    • Report Card
  • Login

Market Analysis

May 14 2024

Unpacking May OPEX: How Will Low Volatility and NVDA Earnings Shape The S&P 500?

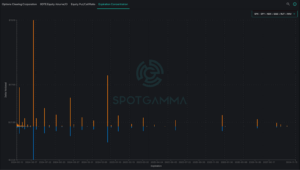
Expiration concentration bar chart of delta notional from 2024 to 2027 featuring orange and blue bars of varying heights.

Key Points: A Brief Synopsis: Large call positions are driving low volatility into May options expiration. The expiration of call positions lines up with several key data points (Fed Speaking, CPI) which may cause volatility to briefly expand into the end of this week (Friday, 5/17), and into VIX expiration & NVDA earnings on 5/22. […]

Written by SpotGamma · Categorized: Market Analysis · Tagged: NVDA, OPEX

Apr 07 2024

Is the Unprecedented Market Calm Driven by 0DTE and Overwriting ETF’s?
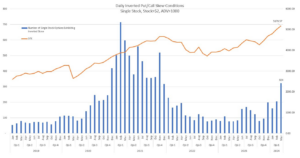
Bar-line chart of inverted put/call skew counts for single stocks >$2 ADV>1000 vs SPX, 2019-2024.

In the presentation and outline posted below, SpotGamma presents a view that equity markets are experiencing dramatically low levels of volatility. The generally low levels of volatility are likely in response to both monetary & fiscal policy, globally, as low volatility is seen across many assets and regions. However, we believe that the impact of […]

Written by SpotGamma · Categorized: Market Analysis

Apr 04 2024

Meta Rips to $530 Then Reverses; SpotGamma Flow Signals Identify Both Sides of the Trade
Doug-Pless-SpotGamma-Meta-Trade-June-2024

When Gamma levels shift higher and options flow aligns, markets can deliver powerful directional moves — and equally sharp reversals. Meta (META) offered a clean example of both in a single session, as bullish positioning drove a rally into liquidity before flow exhaustion marked the high of the day. SpotGamma tools highlighted a strong bullish […]

Written by SpotGamma · Categorized: Market Analysis · Tagged: Case Study, Doug Pless, META

Mar 27 2024

SpotGamma with Public: Semi Skews & the Stock Bubble
SpotGamma with Public Bokerage

Brent Kochuba, Founder of SpotGamma, joined brokerage Public to discuss semi stock skews, and why he thinks stocks are in a bubble. However, that bubble may continue to expand – watch to find out why. Below is an automated transcript, please forgive any grammatical errors: Hey everyone welcome to Leading Indicator, a show bringing you […]

Written by SpotGamma · Categorized: Market Analysis · Tagged: dispersion, Public, skew

Mar 19 2024

SpotGamma on TastyTrade: NVDA, 0DTE, VIX Exp & FOMC

SpotGamma Victor Jones tastytrade Interview

Brent Kochuba, Founder of SpotGamma, joined Victor Jones & TastyTrade to discuss a variety of topics including:

Written by SpotGamma · Categorized: Market Analysis · Tagged: tastytrade

Mar 15 2024

Systematic Call Overwriting In Action: QYLD
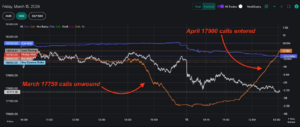
Line chart of NDX on March 15, 2024 showing March 17750 calls unwound and April 17900 calls entered

With all the attention on systematic options portfolios, here is a great view into what happens with $QYLD, the Nasdaq BuyWrite ETF ($8bn AUM). Each month they sell 1 month, ATM NDX calls against a stock portfolio. Call flow is shown via the orange line in our HIRO graphic, which essentially measures the delta of […]

Written by SpotGamma · Categorized: Market Analysis · Tagged: covered call, QYLD

Mar 15 2024

March Call Demand & The Stock Market Bubble

march 2024 opex effect brent kochuba jack forehand

SpotGamma Founder, Brent Kochuba, discusses the options landscape into a massive March Options expiration. Here they cover dispersion, correlation, option skew, and why these metrics point to a short term equity top.

Written by SpotGamma · Categorized: Market Analysis · Tagged: Excess Returns

Mar 14 2024

How SpotGamma Identified NVDA’s 900 Reversal — And Mapped the Entire Move Lower
Doug-Pless-SpotGamma-NVDA-Reversal-Trade-March-2024

This NVDA case study shows how a single level — the 900 Call Wall — set the stage for a high-probability intraday reversal, with SpotGamma tools mapping the move from resistance all the way down to key support levels. By combining positional analysis with real-time flow signals from HIRO, traders could anticipate both the breakdown […]

Written by SpotGamma · Categorized: Market Analysis · Tagged: Case Study, Doug Pless, NVDA

Mar 08 2024

Why is the VIX So Low? Structured Products Offer an Answer

Three-panel BIS chart of VIX and ETF flows, ODTE leverage versus returns, and 1MTE versus ODTE bars through 2023.

Equity market volatility (VIX) has been surprisingly low in 2023 despite uncertainty about interest rates and geopolitics. Some attribute this to the rise of short-term “zero-days-to-expiry” (0DTE) options trading. However, a recent article by the BIS argues that 0DTE trading is unlikely to be the main cause for low VIX and provides an alternative explanation: […]

Written by SpotGamma · Categorized: Market Analysis · Tagged: "0DTE options", "structured products", "yield enhancement, VIX, volatility

Mar 01 2024

Dispersion, Correlation, Volatility and the Stock Bubble

Four line charts show S&P 500 and S&P MidCap 400 dispersion, volatility, and correlation from Feb 2019-Feb 2024.

Dispersion readings are hitting highs per @SPGlobal, particularly in Mid Caps, while correlation is moving toward lows and volatility is flat. What does that mean? Why does it matter? High dispersion means individual components of an index are moving more than the whole, similar to the idea of market breadth. Traders have complained that the […]

Written by SpotGamma · Categorized: Market Analysis · Tagged: correlation, dispersion, stock bubble, volatiltiy

  • « Go to Previous Page
  • Go to page 1
  • Interim pages omitted …
  • Go to page 20
  • Go to page 21
  • Go to page 22
  • Go to page 23
  • Go to page 24
  • Interim pages omitted …
  • Go to page 71
  • Go to Next Page »

Primary Sidebar

SpotGamma-Subscriber-Signup-Banner

  • The Volatility Trap: What Options Markets Reveal About the Next Two Weeks
  • Tech Vol Collapsed, Put Skew Held Rich: Options Action Live on CNBC
  • Gamma Guy: The 0DTE Flow That Usually Pins the Index Didn’t Arrive
  • AMD Earnings Preview: Can AI Growth Overcome Rising Volatility and Expectations?
  • Relatively Few Traders Are Positioned For The Right Tail
  • youtube
  • x
  • Privacy Policy
  • Disclaimer
  • Terms & Conditions
  • Support Center
  • Media
  • Contact Us

©2026 TenTen Capital LLC DBA SpotGamma

All SpotGamma materials, information, and presentations are for educational purposes only and should not be considered specific investment advice nor recommendations. Futures, foreign currency and options trading contains substantial risk and is not for every investor. An investor could potentially lose all or more than the initial investment. Risk capital is money that can be lost without jeopardizing one's financial security or lifestyle. Only risk capital should be used for trading and only those with sufficient risk capital should consider trading. Past performance is not necessarily indicative of future results. Testimonials appearing on this website may not be representative of other clients or customers and is not a guarantee of future performance or success.

View Full Risk Disclosure