
Brent Kochuba, Founder of SpotGamma, joined Victor Jones & TastyTrade to discuss a variety of topics including:
Market Analysis
Systematic Call Overwriting In Action: QYLD
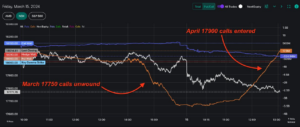
With all the attention on systematic options portfolios, here is a great view into what happens with $QYLD, the Nasdaq BuyWrite ETF ($8bn AUM). Each month they sell 1 month, ATM NDX calls against a stock portfolio. Call flow is shown via the orange line in our HIRO graphic, which essentially measures the delta of […]
March Call Demand & The Stock Market Bubble

SpotGamma Founder, Brent Kochuba, discusses the options landscape into a massive March Options expiration. Here they cover dispersion, correlation, option skew, and why these metrics point to a short term equity top.
How SpotGamma Identified NVDA’s 900 Reversal — And Mapped the Entire Move Lower
This NVDA case study shows how a single level — the 900 Call Wall — set the stage for a high-probability intraday reversal, with SpotGamma tools mapping the move from resistance all the way down to key support levels. By combining positional analysis with real-time flow signals from HIRO, traders could anticipate both the breakdown […]
Why is the VIX So Low? Structured Products Offer an Answer

Equity market volatility (VIX) has been surprisingly low in 2023 despite uncertainty about interest rates and geopolitics. Some attribute this to the rise of short-term “zero-days-to-expiry” (0DTE) options trading. However, a recent article by the BIS argues that 0DTE trading is unlikely to be the main cause for low VIX and provides an alternative explanation: […]
Dispersion, Correlation, Volatility and the Stock Bubble

Dispersion readings are hitting highs per @SPGlobal, particularly in Mid Caps, while correlation is moving toward lows and volatility is flat. What does that mean? Why does it matter? High dispersion means individual components of an index are moving more than the whole, similar to the idea of market breadth. Traders have complained that the […]
The OPEX Effect: Feb Edition

SpotGamma Founder, Brent Kochuba, talks about the extreme call skews, and why that may lead to some stock price consolidation into the end of February.
Do Call Skews Signal Bulls Are Maxed Out?
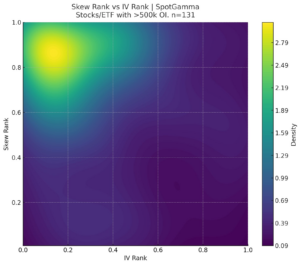
With equities surging higher, the signs of rampant bullishness are percolating. Year-to-date, broad based equity indexes, like the S&P500, are +5.8%, while leading sectors like the SMH (Van Eck Semi ETF) have surged an eye-watering +17.8%. But, how do you know when the bullishness has gone from a “strong trend” to “exuberance”? For that, we […]
Comparing Earnings IV’s for Edge
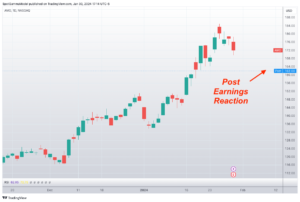
In a recent Member Q&A session SpotGamma discussed how traders can analyze implied volatility and potential stock movements by comparing the relative moves and reaction of stocks in similar sectors. Here we look at the volatility & setup into SMCI’s earnings report, and its subsequent reaction, to guide us on what may happen for AMD […]
TSLA Volatility Falling Despite Being Down 10%
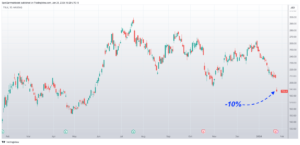
TSLA is down 10% after earnings, and our data is suggesting that if anything, TSLA options are now cheap! One would think that may lead to an increase in options implied volatility, as the implied move was just 6%. You can see this in the legend in our earnings dashboard, below. This shows us the […]