• Skip to main content
  • Skip to primary sidebar

SpotGamma™

S&P 500 Stock Market Gamma Trading Levels Based on Options Open Interest

  • About
  • Pricing
  • Academy
  • Resources
    • Tool Demos
    • Case Studies
    • Blog
    • Support Center
    • Daily Report
    • Free Trading Tools
      • Opening Setup Free Report
      • Options Profit Calculator
      • SPX Gamma Exposure
      • Implied Earnings Moves
    • Report Card
  • Login

AI trade unwind

Nov 01 2026

Big Tech Earnings Crack the Market

Several major tech earnings missed last week, sparking the market’s worst selloff since June. Disappointing results and swelling AI capex concerns drove the Nasdaq 100 down 6% in two days, with the S&P dropping 1.8% on Friday alone. The Binance hack on Thursday added more fuel to the fire. Traders are now left wondering if […]

Written by SpotGamma · Categorized: Market Analysis, SpotGamma Weekly · Tagged: 0DTE options, AI trade unwind, Big Tech earnings, dealer gamma, GLD options, implied volatility, options positioning, options skew, spotgamma weekly, SPX options skew, SPX term structure, stock market selloff, volatility spike

Oct 25 2026

Dip Buyers Step into the AI Unwind

Will the Selloff Continue? The market began to waver at the end of last week, with the S&P 500 down nearly 2% and Nasdaq dropping 3% from mid-week highs. We noted a spike in MAGS put buying and a rising put/call ratio in our previous Sunday Newsletter as big tech earnings approached. Then, our October […]

Written by Sherry An · Categorized: Market Analysis, SpotGamma Weekly · Tagged: AI trade unwind, CRWV call option, dealer gamma, DRAM call option, FOMC, implied volatility, NBIS calls, October OPEX, options positioning, options skew, SKHY calls, spotgamma weekly, SPX term structure, stock market selloff, volatility spike

Aug 02 2026

The New Normal in Volatility Takes Shape
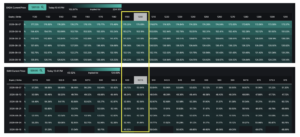
Options implied volatility skew tables for SNDK and SMH showing strike prices and expiration dates through September 2026.

The final week of July proved to be quite dramatic. An FOMC decision, PCE inflation data, and the Super Bowl of Q2 earnings all took place over the span of just 2 days, with companies representing 36% of the S&P 500 by weight reporting results last week. The results were extreme: U.S. 30-year treasury yields […]

Written by Sherry An · Categorized: Market Analysis, SpotGamma Weekly · Tagged: AI trade unwind, collar strategy, dealer gamma, earnings implied move, implied volatility, options positioning, semiconductor stocks, semiconductor volatility, SNDK options, SNDK volatility, SPCX earnings, SPCX lockup, spotgamma weekly

Jul 26 2026

Big Tech Earnings and FOMC Collide

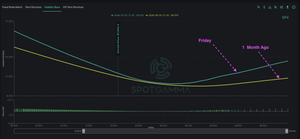
NDX term structure chart showing implied volatility across expirations from July to August 2026, with peaks at FOMC and tech earnings dates.

The Dispersion Unwind Arrives Last week, we noted in our pre-market Founder’s Note that markets were skating on thin ice. In addition to growing macro risks, COR1M had collapsed below 8 signaling extreme dispersion between index and single-stock volatility. After our Risk Pivot level was breached on Thursday, the growing negative gamma environment amplified the […]

Written by Sherry An · Categorized: Market Analysis, SpotGamma Weekly · Tagged: AI trade unwind, dealer gamma, earnings implied move, earnings volatility, Gamma Exposure, implied volatility, INTC options, Intel earnings, July OPEX, Mag 7 earnings, market makers, options positioning, realized volatility, S&P 500 volatility, semiconductor stocks, spotgamma weekly, synthetic gamma

Jul 19 2026

Will the AI Unwind Finally Spill Over?
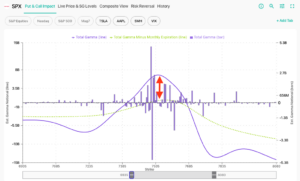
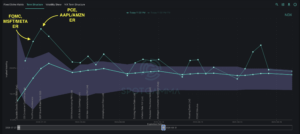
SPX put and call gamma impact chart showing strike prices 6935-8080 with total gamma line peaking near 7535 strike.

Last week delivered a string of constructive catalysts that supported the market through Thursday. Inflation ran cooler than expected, bank earnings impressed, retail sales beat, and ASML and TSM offered encouraging commentary towards semiconductor demand. While hostilities with Iran escalated, the market remained quite stable until Friday’s 1% drop following the Kimi-3 announcement. The stability […]

Written by Sherry An · Categorized: Market Analysis, SpotGamma Weekly · Tagged: AI trade unwind, dealer gamma, earnings implied move, earnings volatility, Gamma Exposure, implied volatility, INTC options, Intel earnings, July OPEX, Mag 7 earnings, market makers, options positioning, realized volatility, S&P 500 volatility, semiconductor stocks, spotgamma weekly, synthetic gamma

Jun 07 2026

The AI Trade Unwinds

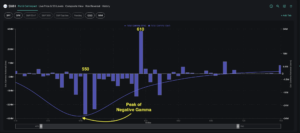
Total gamma bar chart with line showing peak negative gamma around 545 strike and positive gamma spike of 610 at higher strike levels.

Wall Street’s historic weekly winning streak came to an abrupt halt last week. On Friday, a sharp NFP report drove the S&P 500 down over 2.6%, leading to a sharp AI selloff and rising bond yields. Adding fuel to the fire, the market now appears to be pricing in a rate hike by the end […]

Written by Sherry An · Categorized: Market Analysis, SpotGamma Weekly · Tagged: AI trade unwind, dealer gamma, dealer hedging, Gamma Exposure, HIRO options flow, implied volatility, market makers, positive gamma, semiconductor selloff, SMH dealer gamma, spotgamma weekly, SPX options positioning, SPX term structure, volatility spasm

Primary Sidebar

SpotGamma-Subscriber-Signup-Banner

  • Tech Vol Collapsed, Put Skew Held Rich: Options Action Live on CNBC
  • Gamma Guy: The 0DTE Flow That Usually Pins the Index Didn’t Arrive
  • AMD Earnings Preview: Can AI Growth Overcome Rising Volatility and Expectations?
  • Relatively Few Traders Are Positioned For The Right Tail
  • Palantir (PLTR) Earnings Preview: Can AI Growth Justify Another Explosive Move?
  • youtube
  • x
  • Privacy Policy
  • Disclaimer
  • Terms & Conditions
  • Support Center
  • Media
  • Contact Us

©2026 TenTen Capital LLC DBA SpotGamma

All SpotGamma materials, information, and presentations are for educational purposes only and should not be considered specific investment advice nor recommendations. Futures, foreign currency and options trading contains substantial risk and is not for every investor. An investor could potentially lose all or more than the initial investment. Risk capital is money that can be lost without jeopardizing one's financial security or lifestyle. Only risk capital should be used for trading and only those with sufficient risk capital should consider trading. Past performance is not necessarily indicative of future results. Testimonials appearing on this website may not be representative of other clients or customers and is not a guarantee of future performance or success.

View Full Risk Disclosure