• Skip to main content
  • Skip to primary sidebar

SpotGamma™

S&P 500 Stock Market Gamma Trading Levels Based on Options Open Interest

  • About
  • Pricing
  • Academy
  • Resources
    • Tool Demos
    • Case Studies
    • Blog
    • Support Center
    • Daily Report
    • Free Trading Tools
      • Opening Setup Free Report
      • Options Profit Calculator
      • SPX Gamma Exposure
      • Implied Earnings Moves
    • Free Training
    • Report Card
  • Login

realized volatility

Oct 07 2026

Last Call: Relatively Few Traders Are Hedging Equity Downside

Bond volatility has jumped while equity downside hedging stays light. See what call skew in TLT, HYG and XLU says about how traders are positioned.

Written by SpotGamma · Categorized: Market Analysis · Tagged: Excess Returns, HYG, implied volatility, interest rates, options positioning, realized volatility, skew, TLT, XLU

Sep 29 2026

Index Put Demand Returns Ahead of Friday’s Jobs Report

Index Put Demand Returns as the VIX Prices 1% Days

Brent Kochuba, founder of SpotGamma, on tastylive: index put demand, same-day options flow, and why weekly vol prices almost no risk premium.

Written by SpotGamma · Categorized: Market Analysis · Tagged: 0DTE, dealer hedging, IWM, Micron earnings, put skew, QQQ, realized volatility, tastylive

Sep 22 2026

NDX Call Skew Has Room While S&P Vol Contracts: Kochuba on tastylive

Brent Kochuba of SpotGamma joined tastylive September 22 on vol expansion, NDX call skew and the dispersion rebuilding across tech.

Written by SpotGamma · Categorized: Market Analysis · Tagged: 0DTE, call skew, dispersion, MU, NDX, realized volatility, SPX, SPY, tastylive

Sep 15 2026

Gamma Guy: S&P 500 Realized Volatility Is the Lowest Since 2020

Gamma Guy: S&P 500 Realized Volatility Is the Lowest Since 2020

Brent Kochuba, founder of SpotGamma, joined tastylive Tuesday to explain why S&P 500 realized volatility sits at 2020 lows ahead of FOMC and a huge OPEX.

Written by SpotGamma · Categorized: Market Analysis · Tagged: 0DTE, FOMC, implied volatility, NDX, negative gamma, OPEX, realized volatility, SPX, tastylive, VIX

Aug 09 2026

Welcome to the Summer Melt-Up

DRAM options gamma chart showing total gamma curve, call/put gamma bars, and volatility points at $45 and $61.5.

The S&P 500 delivered a high octane four-day run last week, establishing all-time highs with a 6% rise from weekly lows. Shifting interest rate expectations, easing Middle East tensions, and strong corporate earnings powered the dramatic rally. The sharp surge brought out notable divergences across the tech space. Software outperformed the broader market, with strong […]

Written by Sherry An · Categorized: Market Analysis, SpotGamma Weekly · Tagged: dealer gamma, dram ETF, dram options, Gamma Exposure, implied volatility, options positioning, options skew, realized volatility, SanDisk stock, semiconductor stocks, spotgamma weekly, synthetic gamma

Jul 26 2026

Big Tech Earnings and FOMC Collide

NDX term structure chart showing implied volatility across expirations from July to August 2026, with peaks at FOMC and tech earnings dates.

The Dispersion Unwind Arrives Last week, we noted in our pre-market Founder’s Note that markets were skating on thin ice. In addition to growing macro risks, COR1M had collapsed below 8 signaling extreme dispersion between index and single-stock volatility. After our Risk Pivot level was breached on Thursday, the growing negative gamma environment amplified the […]

Written by Sherry An · Categorized: Market Analysis, SpotGamma Weekly · Tagged: AI trade unwind, dealer gamma, earnings implied move, earnings volatility, Gamma Exposure, implied volatility, INTC options, Intel earnings, July OPEX, Mag 7 earnings, market makers, options positioning, realized volatility, S&P 500 volatility, semiconductor stocks, spotgamma weekly, synthetic gamma

Jul 19 2026

Will the AI Unwind Finally Spill Over?
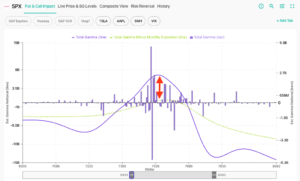
SPX put and call gamma impact chart showing strike prices 6935-8080 with total gamma line peaking near 7535 strike.

Last week delivered a string of constructive catalysts that supported the market through Thursday. Inflation ran cooler than expected, bank earnings impressed, retail sales beat, and ASML and TSM offered encouraging commentary towards semiconductor demand. While hostilities with Iran escalated, the market remained quite stable until Friday’s 1% drop following the Kimi-3 announcement. The stability […]

Written by Sherry An · Categorized: Market Analysis, SpotGamma Weekly · Tagged: AI trade unwind, dealer gamma, earnings implied move, earnings volatility, Gamma Exposure, implied volatility, INTC options, Intel earnings, July OPEX, Mag 7 earnings, market makers, options positioning, realized volatility, S&P 500 volatility, semiconductor stocks, spotgamma weekly, synthetic gamma

Jul 12 2026

Volatility Approaches Record Lows — Is It Priced Too Cheap?
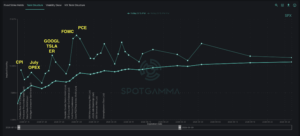
SPX term structure chart showing implied volatility curves from July through September 2026, with major events labeled.

The S&P 500 spent early July grinding higher with sector rotation quietly forming beneath a calm index. As SPX price action remained relatively muted over the past week, implied volatility dropped to near-record lows as of Friday: IV for contracts expiring next week now sit in the 6-10% range. Regardless of any directional bias for […]

Written by Sherry An · Categorized: Market Analysis, SpotGamma Weekly · Tagged: dealer gamma, earnings volatility, Gamma Exposure, implied volatility, July OPEX, market makers, Netflix options, NFLX earnings, options positioning, options term structure, options trading, realized volatility, S&P 500 volatility, spotgamma weekly, SPX put fly, synthetic gamma

Jun 19 2024

Stock & Bond Correlations: “No Crying in Correlation”
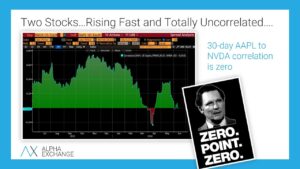
Alpha Exchange Stocks and Bonds Correlation

Alpha Exchange

Written by SpotGamma · Categorized: Market Analysis · Tagged: Alpha Exchange, correlation, dispersion, NVDA, realized volatility

Jul 14 2021

Implied Volatility Reading in the SPX & VIX

Brent Kochuba, Founder of SpotGamma, joins Imran Lakha of Options-Insights to talk about the current volatility readings in the SPX and VIX. This covers both realized and implied volatility which are shifting ahead of a large options expiration.

Written by developer · Categorized: Market Analysis · Tagged: implied volatility, realized volatility, VIX

  • Go to page 1
  • Go to page 2
  • Go to Next Page »

Primary Sidebar

SpotGamma-Subscriber-Signup-Banner

  • ORCL Insider Buying: Director Makes $3.5 Million Bet as Options Market Signals Caution
  • Delta Earnings Preview: Options Price a Meaningful Move as Fuel Costs Test the Bull Case
  • Last Call: Relatively Few Traders Are Hedging Equity Downside
  • LEAPS Options: Long-Term Exposure With Less Capital
  • Covered Calls: The Complete Guide to Selling Calls Against Stock
  • youtube
  • x
  • Privacy Policy
  • Disclaimer
  • Terms & Conditions
  • Support Center
  • Media
  • Contact Us

©2026 TenTen Capital LLC DBA SpotGamma

All SpotGamma materials, information, and presentations are for educational purposes only and should not be considered specific investment advice nor recommendations. Futures, foreign currency and options trading contains substantial risk and is not for every investor. An investor could potentially lose all or more than the initial investment. Risk capital is money that can be lost without jeopardizing one's financial security or lifestyle. Only risk capital should be used for trading and only those with sufficient risk capital should consider trading. Past performance is not necessarily indicative of future results. Testimonials appearing on this website may not be representative of other clients or customers and is not a guarantee of future performance or success.

View Full Risk Disclosure