Micron (MU) reports earnings Wednesday after the close, and this may be one of the most important market events of the week.
The company has become a major beneficiary of the AI infrastructure boom as demand for high-bandwidth memory, or HBM, continues to surge. But after a massive run in the stock and enormous earnings growth, expectations are already extremely high.
That makes this earnings report less about whether Micron beats estimates and more about one question:
Can the current memory boom continue into 2027?
What Wall Street Is Watching
Micron has already guided to another extremely strong quarter, with expectations near $50 billion in revenue and more than $31 per share in adjusted earnings.
Those numbers would represent extraordinary growth, but the market already knows the current quarter should be strong.
The more important number may be next quarter’s guidance.
Investors will want to hear continued confidence around:
- HBM demand into 2027
- DRAM and NAND pricing
- Gross margins
- AI-related customer demand
- Future manufacturing capacity
A strong earnings beat followed by another guidance increase would reinforce the idea that this memory cycle has more room to run.
Strong results paired with cautious guidance could produce a much different reaction. That guidance matters because Micron is benefiting from one of the strongest memory environments in years.
Fundamentals: AI Is Driving a New Memory Cycle
Micron makes DRAM and NAND memory used across computers, smartphones, servers and data centers. But the biggest driver today is HBM, a specialized type of memory used alongside advanced AI processors.
As companies build larger AI data centers, demand for HBM has surged while supply remains relatively tight. That has helped push memory prices higher and dramatically improve Micron’s profitability.
Micron is already shipping next-generation HBM products and has secured billions of dollars in future customer commitments, giving investors better visibility into demand.
The broader memory market has also strengthened. Higher DRAM and NAND prices have helped Micron expand margins at a pace rarely seen in the historically cyclical memory industry.
That strength is also the biggest risk.
Memory businesses traditionally move through boom-and-bust cycles. When prices rise sharply, manufacturers eventually increase production. Too much supply can then pressure pricing and profits.
That means investors will be listening closely for any indication that memory prices, margins or demand are beginning to peak.
Technicals and Sentiment
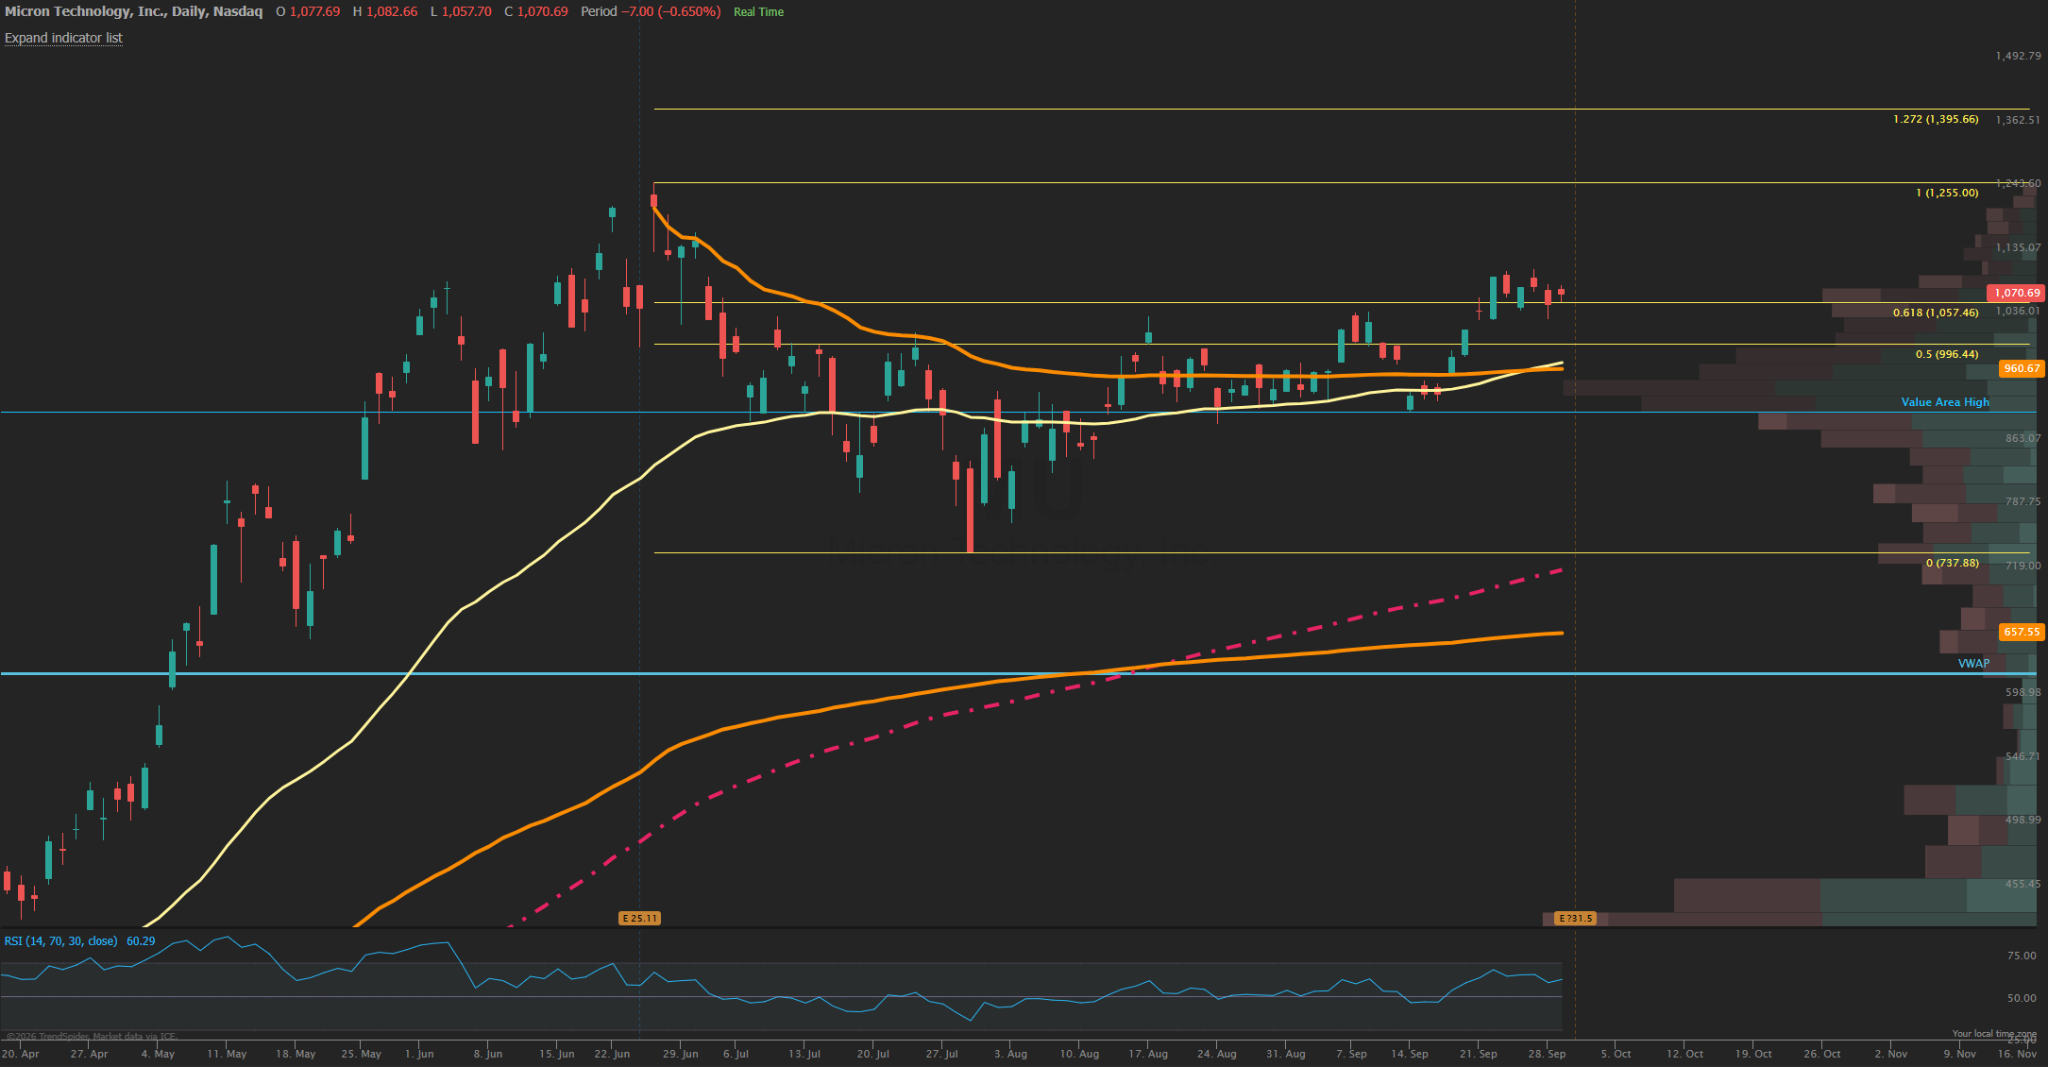
Micron has been one of the strongest semiconductor stocks of 2026, gaining roughly 280% year to date.
That momentum shows how bullish investor sentiment has become, but it also raises the bar going into earnings. MU recently traded as high as the $1,100 area the past week after making its mid September low around $900.
More importantly, buyers have continued to step in since the sharp late-July selloff, suggesting the longer-term trend remains intact heading into earnings.
Wall Street remains broadly bullish on the long-term AI memory story, but the debate is beginning to shift.
The question is no longer whether Micron’s earnings are growing.
It is how sustainable those earnings are once memory supply begins catching up with demand.
What the Options Market Is Pricing
Options traders are expecting another large move.
The options market is currently pricing roughly a 8% move in either direction around earnings.
With options pricing an 8% move, and based on Tuesday’s closing price of 1065 the market is implying a post-earnings range of roughly $985 to $1,150. A decisive move beyond either boundary would suggest the earnings surprise was larger than options traders had priced in.
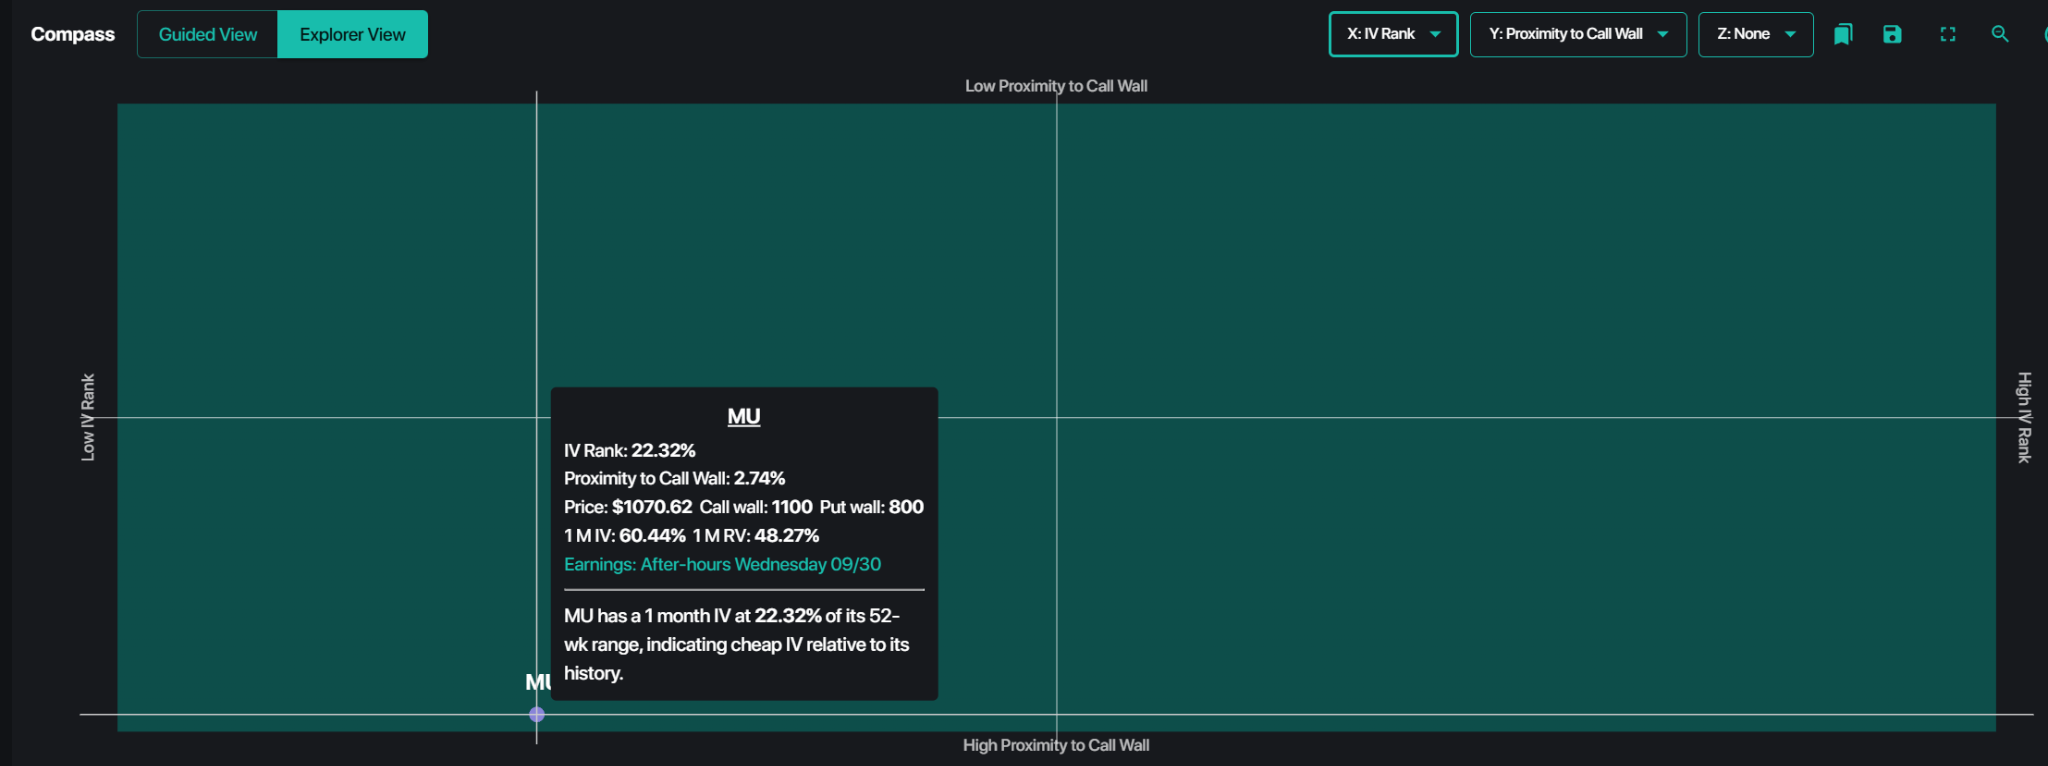
That does not mean traders expect Micron to rise or fall 8%. The implied move simply reflects how much volatility the options market expects after the report. IV rank sits at 22% which is in the lower quartile of its yearly range while the stock is bumping up against the gamma call wall of $1100.
Micron’s previous earnings reaction was even larger, with the stock jumping more than 15% following its June report.
So while a 8% move sounds extreme, recent history shows that Micron is capable of producing much larger earnings reactions when guidance meaningfully changes the outlook.
Using a consistent ATM-straddle-based historical dataset, here are Micron’s last eight earnings reports with the options-implied move immediately ahead of earnings versus the actual close-to-close move the following trading session.
| Earnings date | Implied move | Actual next-day move | Result vs. implied |
|---|---|---|---|
| Jun. 24, 2026 | ±9.4% | +15.7% | Outside by 6.3 pts |
| Mar. 18, 2026 | ±6.6% | -3.8% | Inside by 2.8 pts |
| Dec. 17, 2025 | ±7.6% | +10.2% | Outside by 2.6 pts |
| Sep. 23, 2025 | ±8.6% | -2.8% | Inside by 5.8 pts |
| Jun. 25, 2025 | ±6.8% | -1.0% | Inside by 5.8 pts |
| Mar. 20, 2025 | ±8.9% | -8.0% | Inside by 0.9 pts |
| Dec. 18, 2024 | ±10.9% | -16.2% | Outside by 5.3 pts |
| Sep. 25, 2024 | ±8.5% | +14.7% | Outside by 6.2 pts |
What stands out
Over the last eight reports, options priced an average move of about 8.4%, while MU actually moved 9.1% on average. The stock exceeded its implied move four times. More importantly, when options underestimated the reaction, they often underestimated it by a lot—including moves of +15.7%, +14.7% and -16.2%.
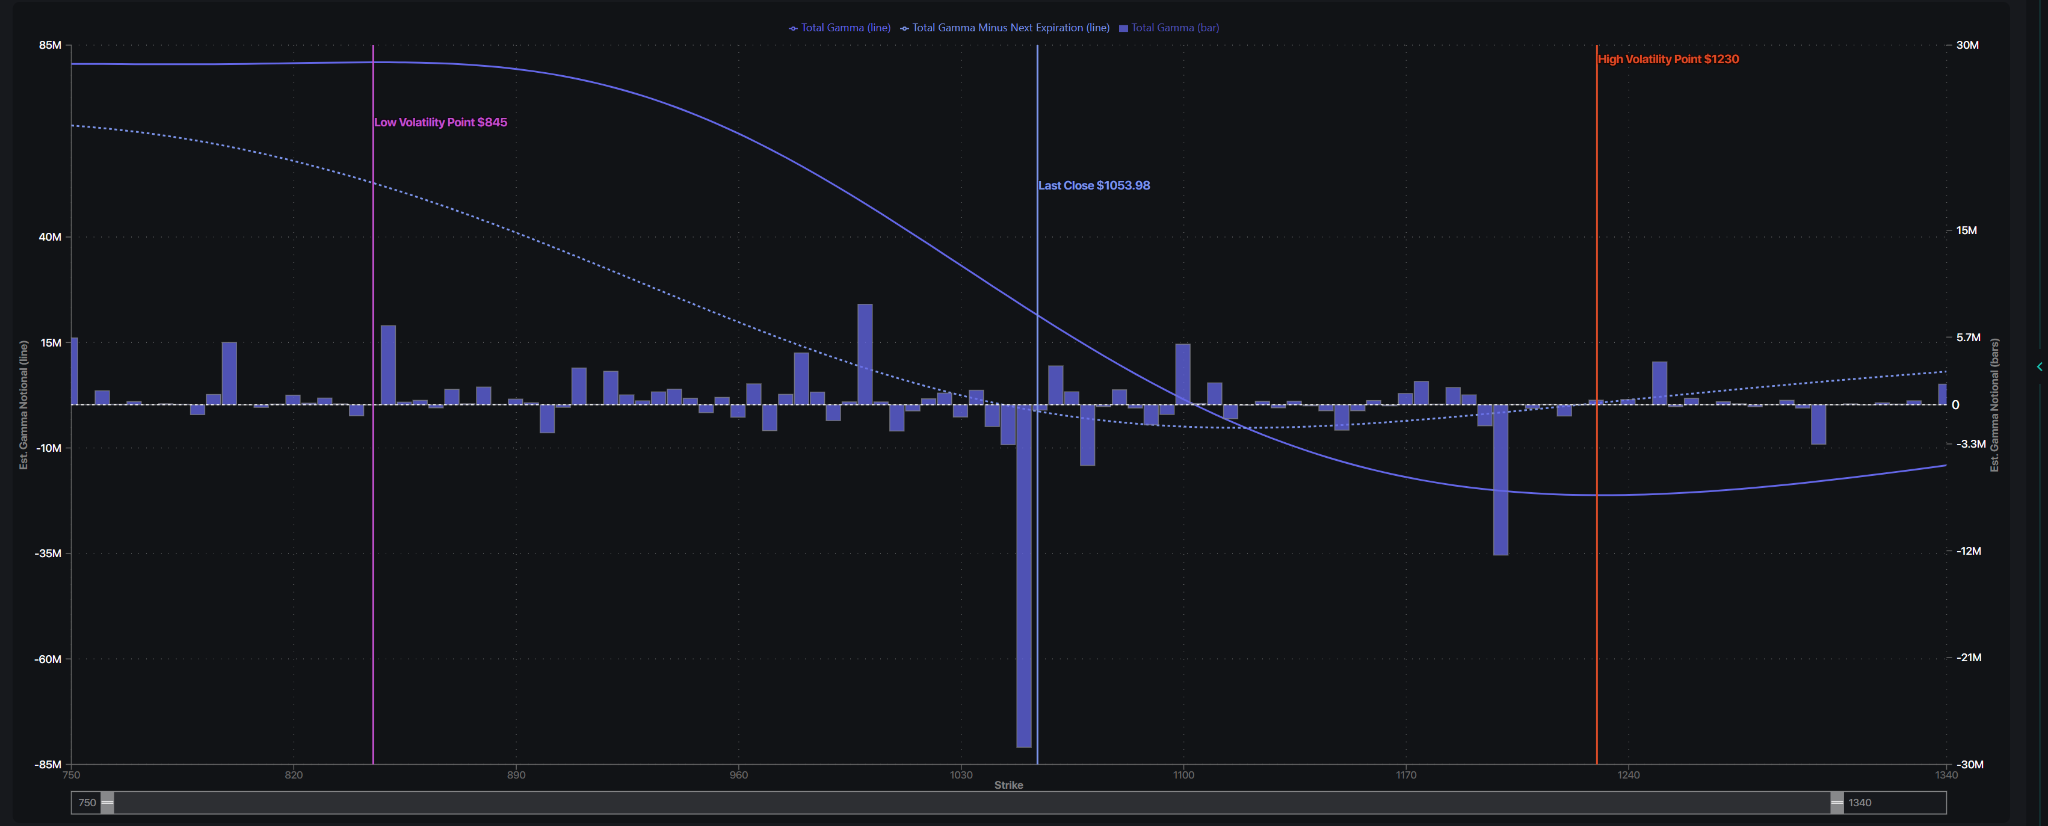
Options positioning has a large negative gamma bar at $1050 which seems to be the battleground for bulls and bears. The stock pushed above the $1000 round number following September options expiration conveniently and is now consolidating ahead of the report.
Options positioning also makes the $1,050-$1,100 area important. A large concentration of dealer positioning sits around $1,050, making it a potential battleground heading into earnings. Above $1,100, negative gamma could amplify a larger move if the stock breaks higher, while $1,000 remains an important downside level.
For beginners, negative gamma simply means dealer hedging can sometimes exaggerate a move once the stock begins trending strongly.
The Setup
The bullish setup is straightforward: beat expectations, raise guidance and reinforce the view that AI-driven memory demand remains strong into 2027.
The bearish case is more subtle. Micron could report excellent results and still sell off if management signals slower pricing growth, weaker margins or improving memory supply. After such a large run, expectations—not simply the headline numbers—may determine the reaction.
Options Trader Takeaway
Micron enters earnings with strong fundamentals, strong momentum and one of the most powerful AI-related growth stories in semiconductors—but very little room for disappointment. With options pricing roughly a 8% move, volatility is already elevated into the event, making outright calls or puts expensive.
The cleaner takeaway is to focus on whether the stock can move beyond the market’s expected range. A reaction above roughly $1,180 would signal that results and guidance materially exceeded already-high expectations, while a break below roughly $985 would suggest investors are questioning the sustainability of the memory cycle. Anything inside that range could favor traders who sold elevated earnings volatility rather than those who paid heavily for directional options.
Potential Trade Structures
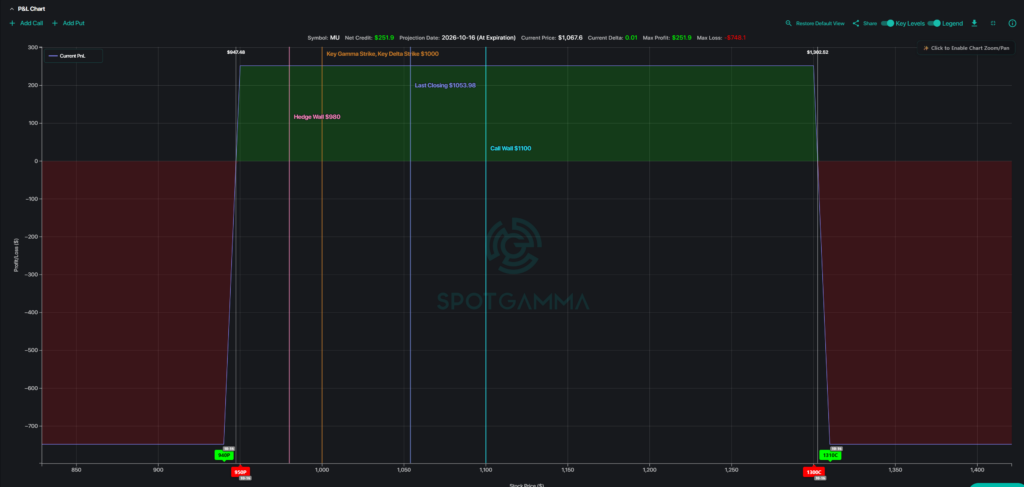
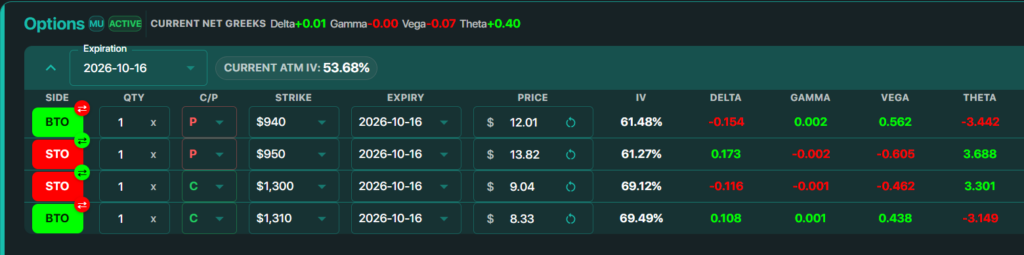
For traders who believe MU stays inside a wider range after earnings, one defined-risk idea is an iron condor selling both the Oct. 16 $940/$950 put spread combined with the $1,300/$1,310 call spread for roughly a $2.50 credit. The maximum risk is $7.50, while both short strikes sit outside the current earnings-implied range. The closer put side gives the position a modest bullish tilt.
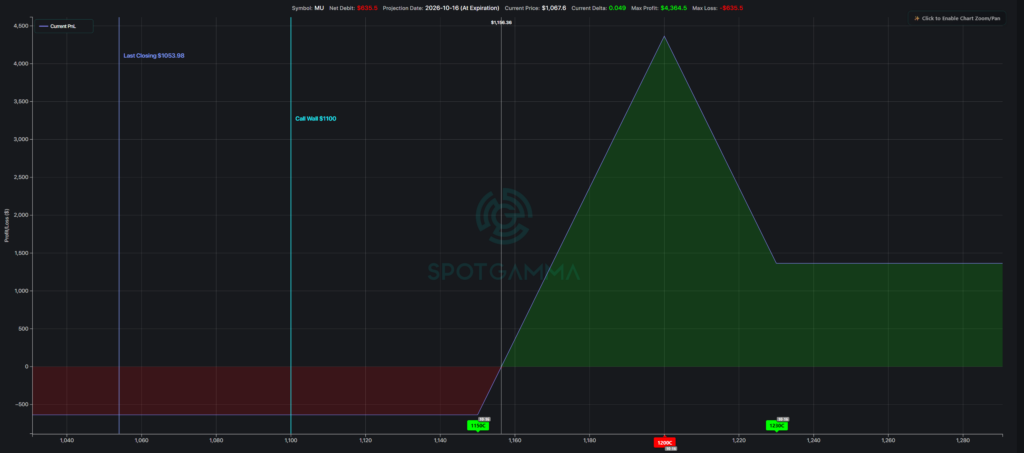
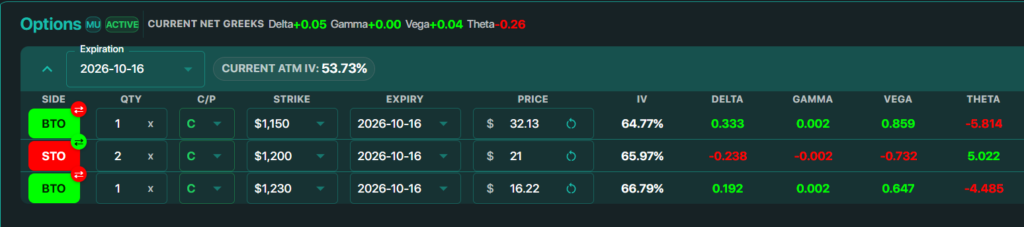
Alternatively, traders looking for bullish defined-risk upside exposure could instead consider the Oct. 16 $1,150/$1,200/$1,230 broken-wing call butterfly for roughly a $6.40 debit. The structure benefits most from a move toward $1,200 while limiting the initial capital at risk. The advantage of the broken wing fly is removing any upside tail risk if earnings were to create a blowoff type of move beyond the upper wing of the butterfly spread.