The stock market faces its biggest economic test of the week Friday morning when the September jobs report is released at 8:30 a.m. ET.
The headline will be how many jobs the U.S. added, but for investors the bigger question is simple:
Does the report give the Federal Reserve another reason to raise interest rates?
That question has become even more important after Treasury yields surged above 5% and the Fed raised rates in September for the first time in three years.
What the Options Market Is Pricing
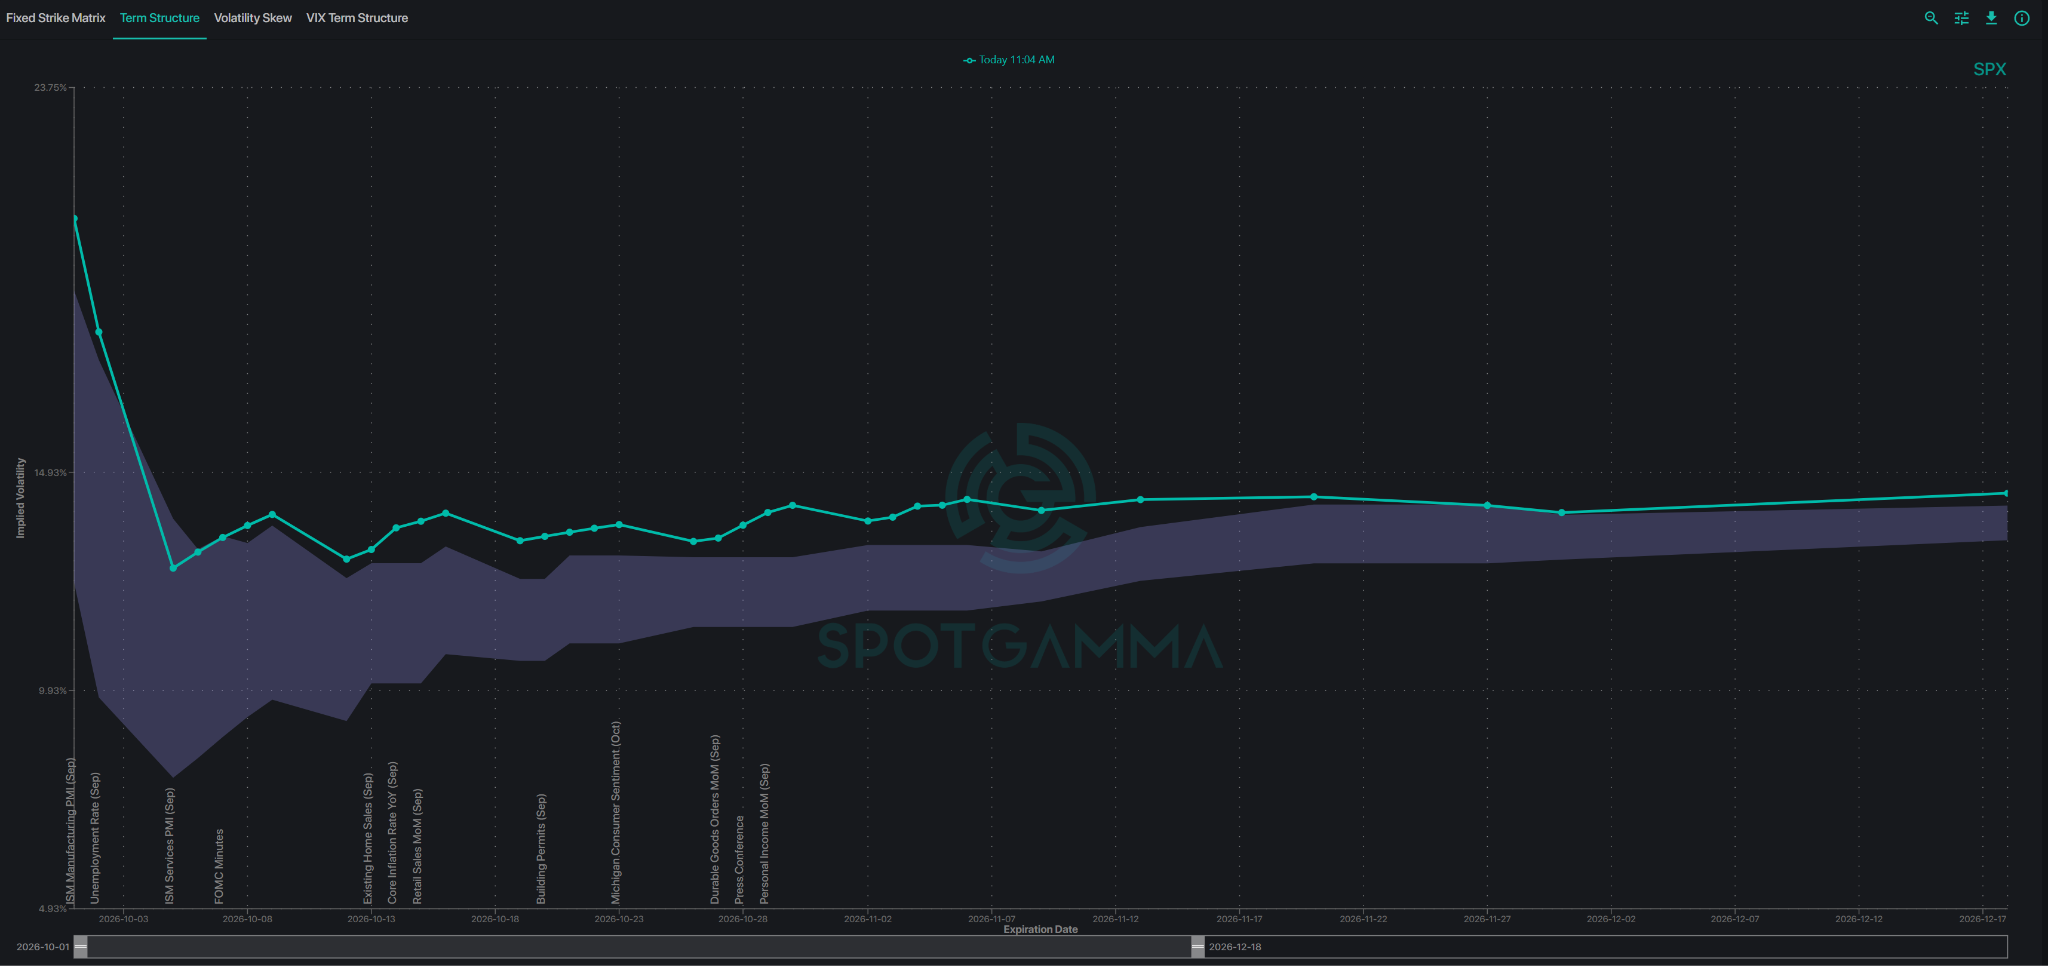
Options traders expect Friday to produce a meaningful move—but not a panic event. The above image shows SPX term structure on the SpotGamma Volatility Dashboard and the front week hump clearly depicts a heightened risk expectation for Friday’s payrolls report. The 18.5% implied volatility for Oct 2 options is well above the 14% for the next several weeks. Even far higher than mid October’s next CPI print and the Oct 28th FOMC meeting.
With SPY around $762 early on Thursday, Friday options currently imply a move of roughly ±$6.60, or ±0.9%, through Friday’s expiration.
QQQ options are pricing a somewhat larger move of about ±1.1%, reflecting technology stocks’ greater sensitivity to interest rates.
That suggests the market expects volatility around the report, but it isn’t pricing an extreme shock.
A jobs number far outside expectations could therefore produce a move larger than what options currently imply.
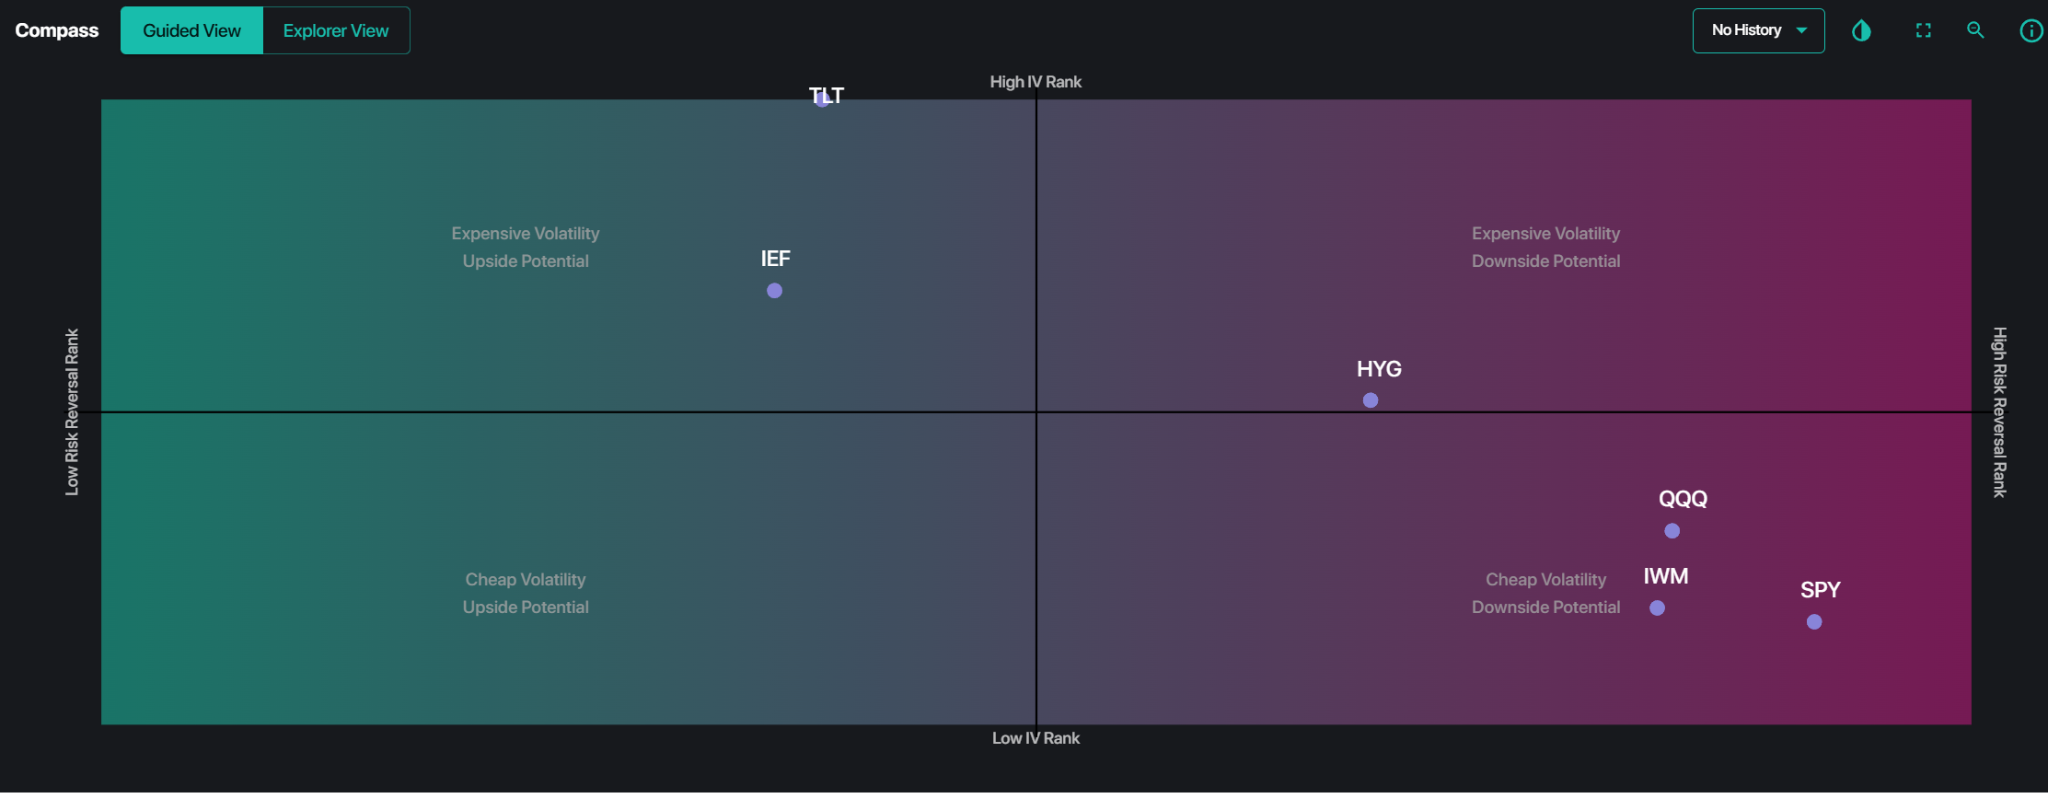
SpotGamma’s Compass map above shows TLT at an IV rank of 100 now as the bond ETF sells off to multi year lows. The options market now has the highest implied volatility of the past year for TLT. The other bond ETF shown is IEF which holds 7-10 year bonds and also is showing elevated implied volatility while oversold from a risk reversal ranking perspective.
The stock ETFs are clustered in the lower right quadrant here showing still relatively cheap volatility based on IV ranks under 30. Downside put hedges remain reasonably priced in the SPY for example while TLT is relatively expensive. It remains to be seen if the bond market volatility spills over into the stock market. The Friday jobs report will be a key catalyst in determining that potential.
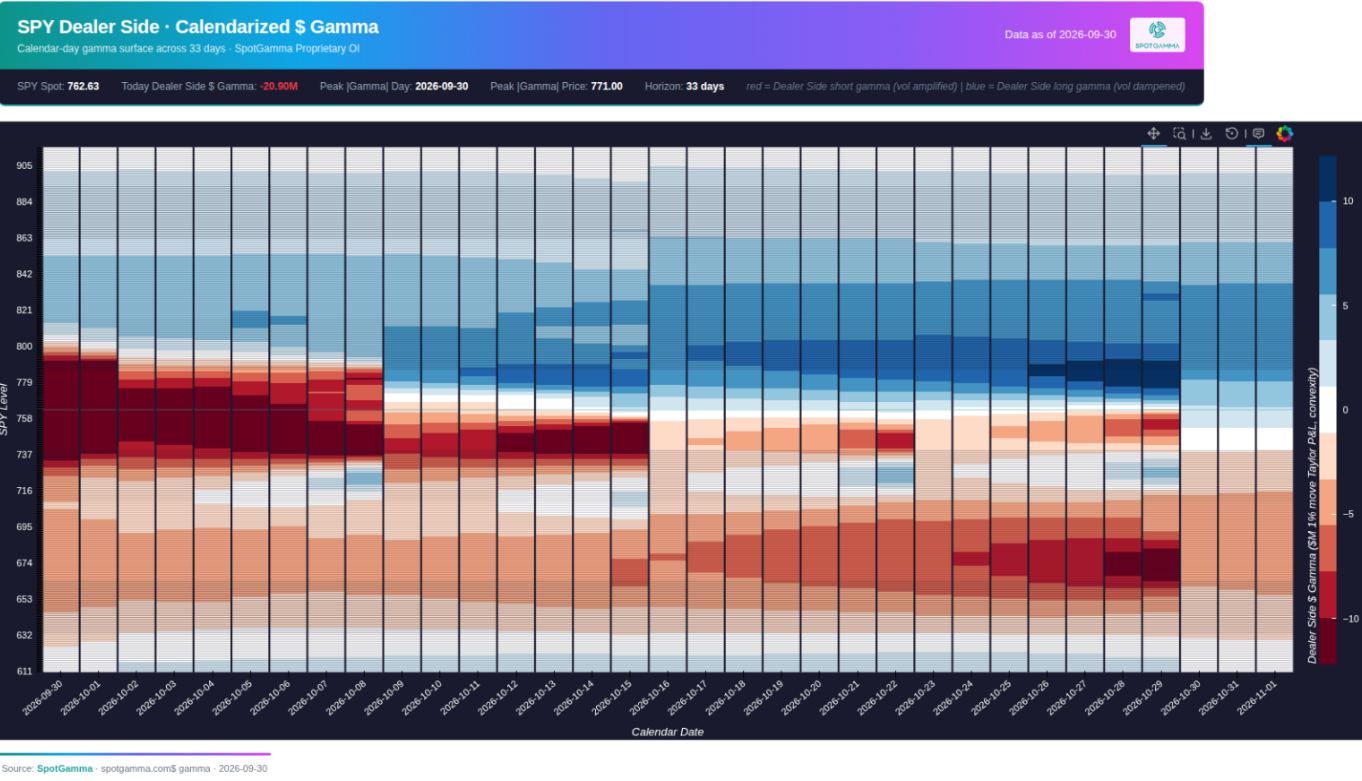
The SpotGamma calendarized gamma map for SPY shows a wide band of negative gamma in red through 10/8 expiration at strike prices below 775 with that condition being present down to 740. That shows the risk of downside being sharp if SPY were to sell off further after the jobs data. Negative gamma allows for prices to flow more freely and thus market makers would have to hedge more aggressively into a down move.
What Wall Street Expects Friday
Current expectations are roughly:
- Nonfarm payrolls: +90,000
- Unemployment: 4.1%
- Wage growth: about +0.3% month over month
That would represent a clear slowdown from the 162,000 jobs added in August, while still suggesting the labor market remains healthy.
For investors, that middle ground may be exactly what the market wants.
What This Week’s Data Is Already Telling Us
The reports leading into Friday have painted a mixed—but generally resilient—picture.
Job openings cooled. Tuesday’s JOLTS report showed openings fell to 7.08 million, below the 7.23 million economists expected. Hiring remains cautious, but layoffs were also low.
Private hiring was stronger than expected. ADP estimated businesses added 90,000 private-sector jobs in September, above the 70,000 expected.
Layoffs remain extremely low. Thursday’s initial jobless claims fell to just 197,000, near a 57-year low, while continuing claims dropped to 1.70 million. That suggests employers still aren’t eager to let workers go.
Manufacturing also remains relatively strong. The September ISM Manufacturing Index came in at 54.5, while its employment component rose to 52.7, signaling factory hiring expanded. The catch was inflation: the prices-paid index jumped to 77.9, showing businesses are still dealing with significant cost pressures.
Put together, the message is fairly simple:
Hiring has slowed, but the labor market does not look weak.
Fed Rate Hike Odds Have Changed Dramatically
This is arguably the most important development of the week.
On Wednesday, the Fed’s preferred PCE inflation measure came in softer than expected at 3.4% year over year versus 3.7% expected. That dramatically reduced expectations for another immediate rate hike.
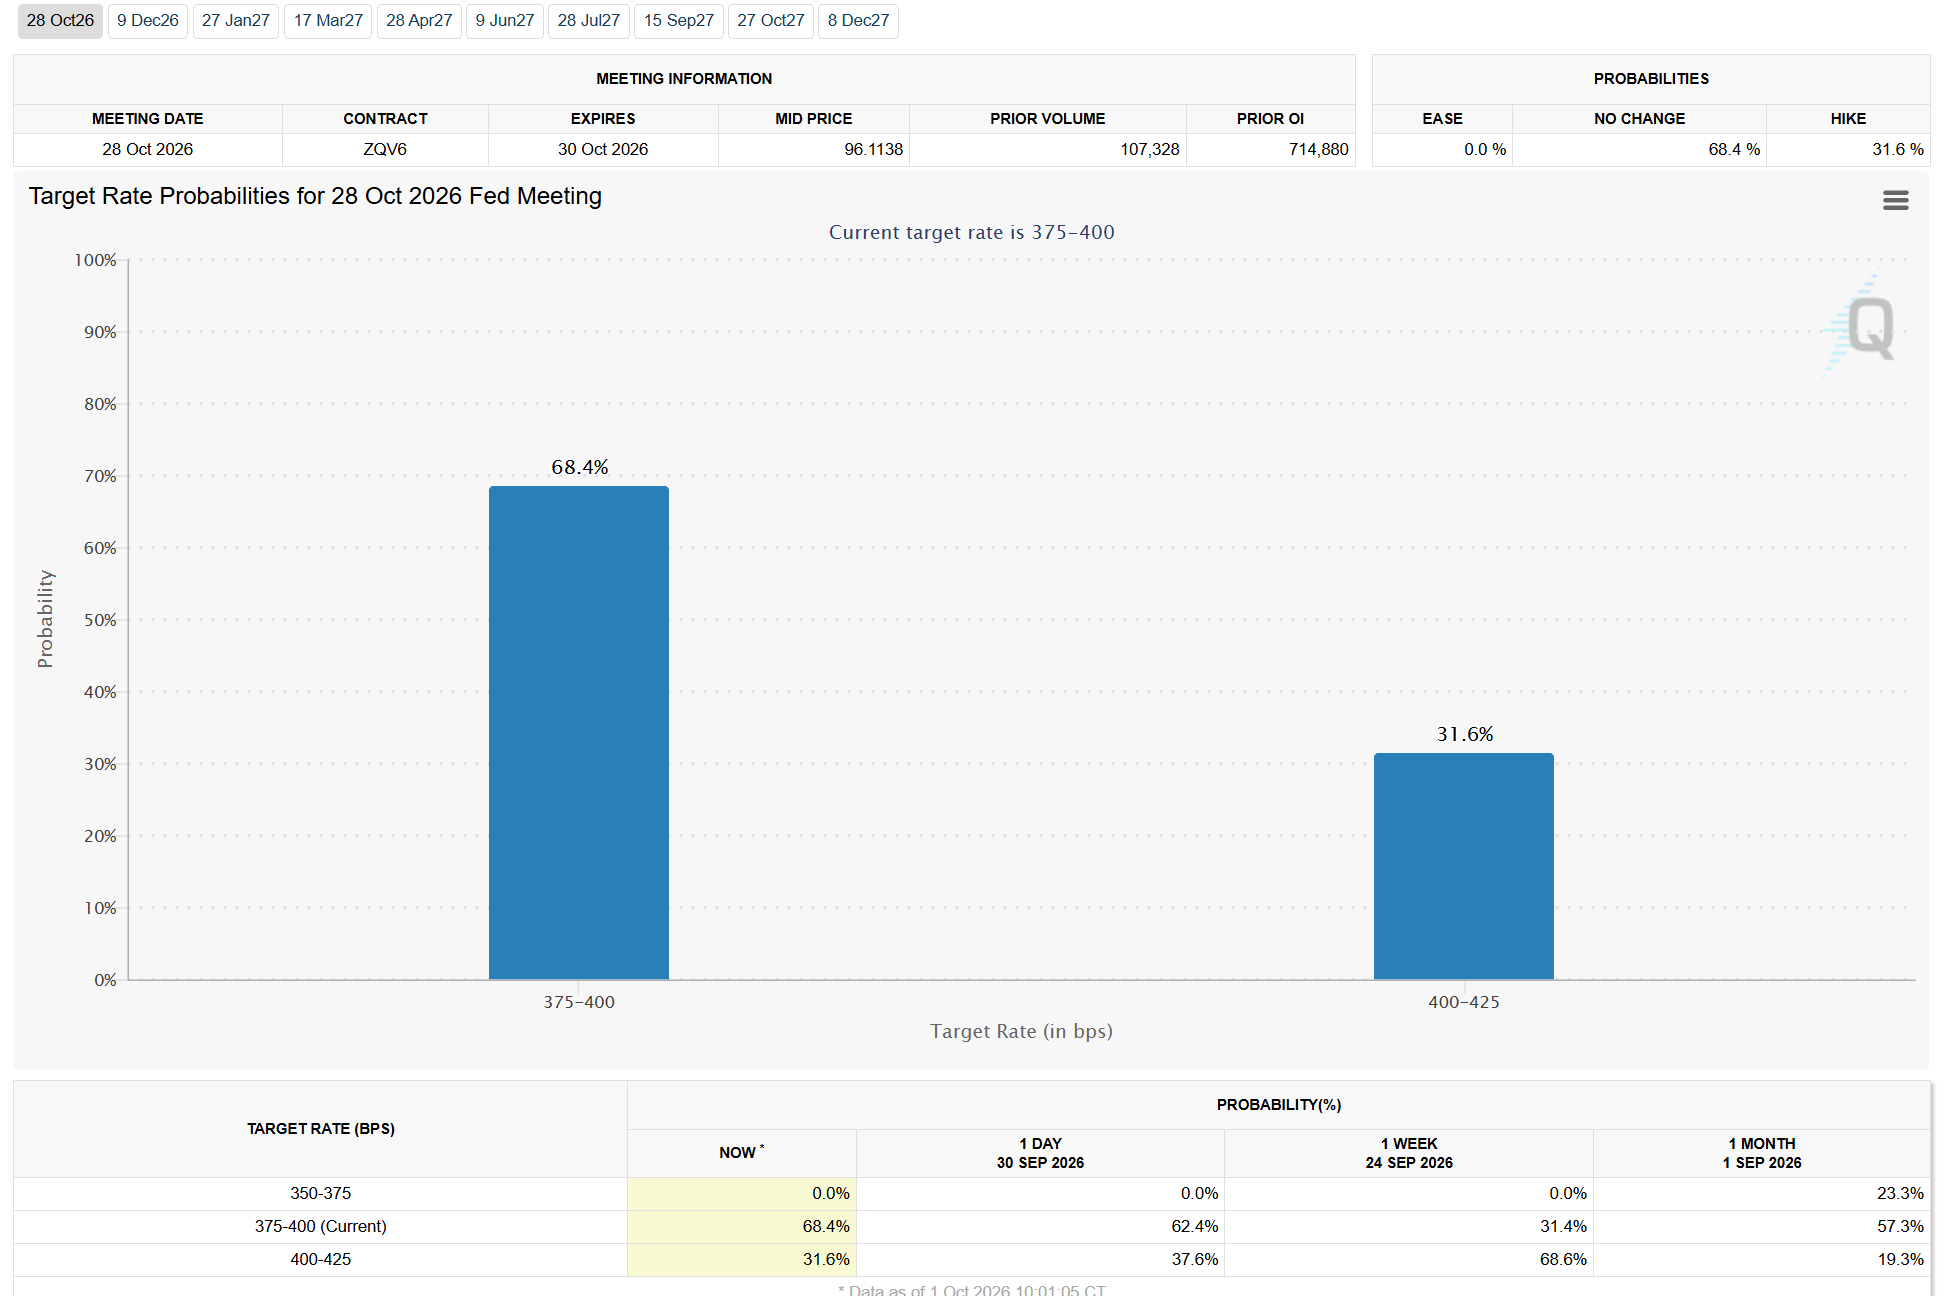
As of Thursday morning, futures markets were pricing roughly a 32% chance of another 25-basis-point Fed hike in October.
Just one week ago, that probability was nearly 70%.
Goldman Sachs has even moved its forecast for the next Fed hike from October to December.
That means Friday’s jobs report now has the ability to move those expectations significantly again.
A very strong report could put an October hike back on the table. A moderate report could reinforce the idea that the Fed can wait.
The Four Jobs Report Scenarios
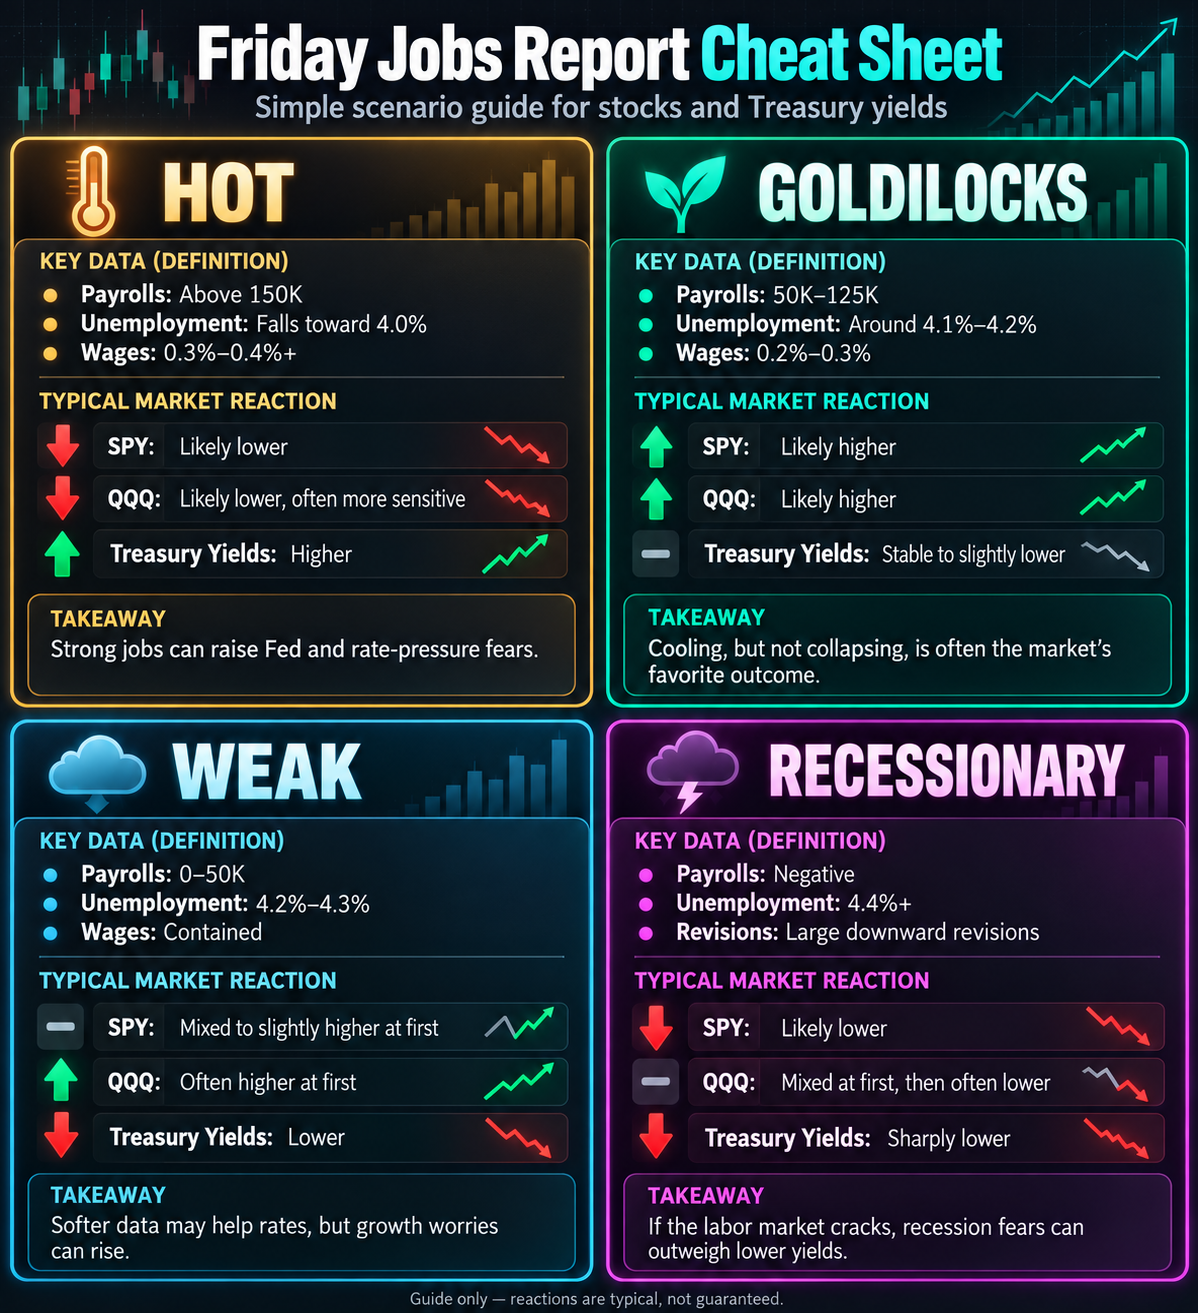
The Trading Takeaway
The market appears to want cooler jobs—not collapsing jobs.
A report somewhere around 50,000–125,000 new jobs with unemployment near 4.1%–4.2% and contained wage growth would likely reinforce the idea that the Fed can pause in October without creating serious concerns about the economy.
The first thing to watch at 8:30 Friday isn’t even SPY.
Watch Treasury yields.
Yields stable to lower + Stocks up: Goldilocks reaction.
Yields up + Stocks down: Markets are pricing more Fed tightening.
Yields down sharply + Stocks down: Recession concerns are taking over.
With October Fed hike odds having already collapsed from roughly 70% to 30% in just a week, Friday’s jobs report has the potential to determine which interest-rate narrative drives the market next.