Over the past several weeks, we have consistently highlighted the market’s growing fragility. From the negative gamma “trapdoor” to the destabilizing impact of geopolitical shocks, the message has been clear: this is no longer a range-bound market.
Last week confirmed those warnings, as the S&P 500 is down nearly 9% from all-time highs. On Thursday and Friday, traders even experienced two consecutive -1.7% sesssions back-to-back. The market fragility flagged over the past two months has materialized into a selloff.
This pullback has now evolved into something more structural. Macro stress and options positioning can readily drive larger, faster price swings in both directions.
As a result, we now see the market transitioning into a higher-volatility regime. This is not simply a bearish environment, it is a reflexive and unstable market.
Negative Gamma and the Loss of Stability
The role of dealer positioning sits at the core of the market’s regime shift. To put it simply, the stabilizing force of positive gamma is now absent.
We remain firmly in a negative gamma environment, where dealers hedge with price action—selling into weakness and buying into strength. This flips the market’s behavior from mean-reverting to momentum-driven, increasing the likelihood of any sharp directional movement.
One of the key structural levels reinforcing this dynamic is the JPM Collar trade, with ~32,000 contracts now centered around SPX 6,475. This position holds nearly $2 billion negative gamma into expiration on March 31.
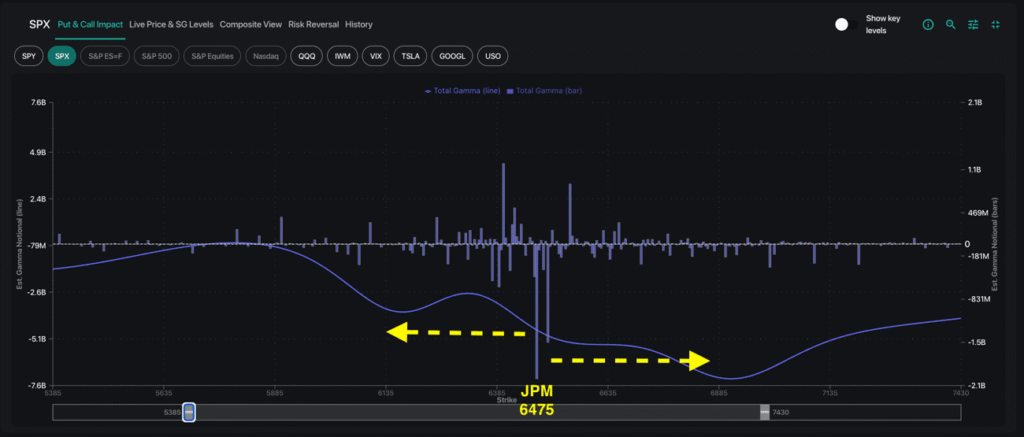
While SPX closed Friday ~100 points below the JPM strike, this level remains impactful by anchoring deep negative dealer gamma. Because of this, realized volatility is amlified around the SPX 6,475 strike, meaning small moves can cascade into larger trends as hedging flows reinforce direction.
As a final cautionary tale, we have often discussed the risks in the “transient stability” provided by 0DTE options. Over the past year, traders largely sold short-dated options, forcing dealers into positive gamma positions. This dynamic has broken down, resulting in a market that feels increasingly unstable: liquidity thins out quickly and relatively small catalysts can trigger outsized moves.
The Volatility Regime: Macro Risk Drives Vol Premium
Crude oil’s surge toward $100 feeds directly into options pricing across asset classes. Rising energy prices from the unfolding Iran conflict induce systemic stress.
We are now seeing the options market reflect this stress across key volatility metrics:
- Broad hedging demand across indices and single stocks
- VIX approaching 1-year highs
- Index options trading at extreme IVs (with implied volatility increasing week-over-week, as shown in the Term Structure chart below)
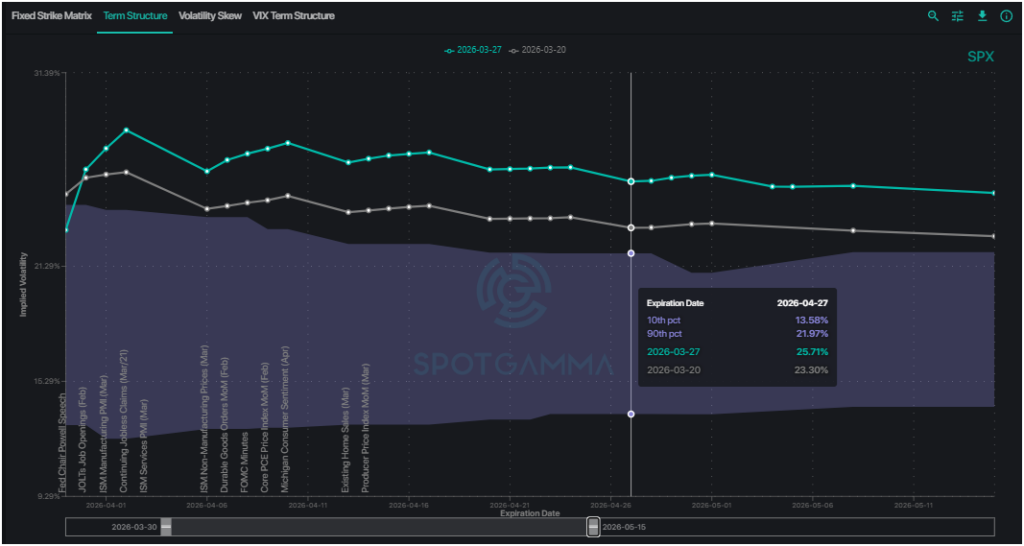
The most important risk indication lies in the gap between implied volatility and realized volatility. With VIX near 30 and SPX 1-month realized volatility at ~13%, the market is pricing in a massive volatility premium. That spread is not sustainable indefinitely.
We see two alternative scenarios: (A) realized volatility rises, with larger price swings taking place throughout the market, or (B) implied volatility compresses back down to more realistically match realized vols.
Note that the above Scenario B requires at least some alleviation of macro stress to bring down options prices.
Fragmented Market Creates Asymmetric Opportunities
At the same time major indices are selling off, multiple major single stock names are already deep in correction territory: Microsoft (-35%), Tesla (-28%), and Meta (-35%) are all significantly below previous highs, highlighting dispersion beneath the surface. The broader market’s structure suggests downside risk may not yet be fully exhausted.
That said, select opportunities are still emerging. Micron (MU) fell 16% last week to 2-month lows at 357 as memory and semiconductor names experienced sharp drawdowns. However, our Synthetic OI model highlights concentrated short put positioning from traders: approximately 25k contracts at the 350 strike, and an additional 29k at the 300 strike.
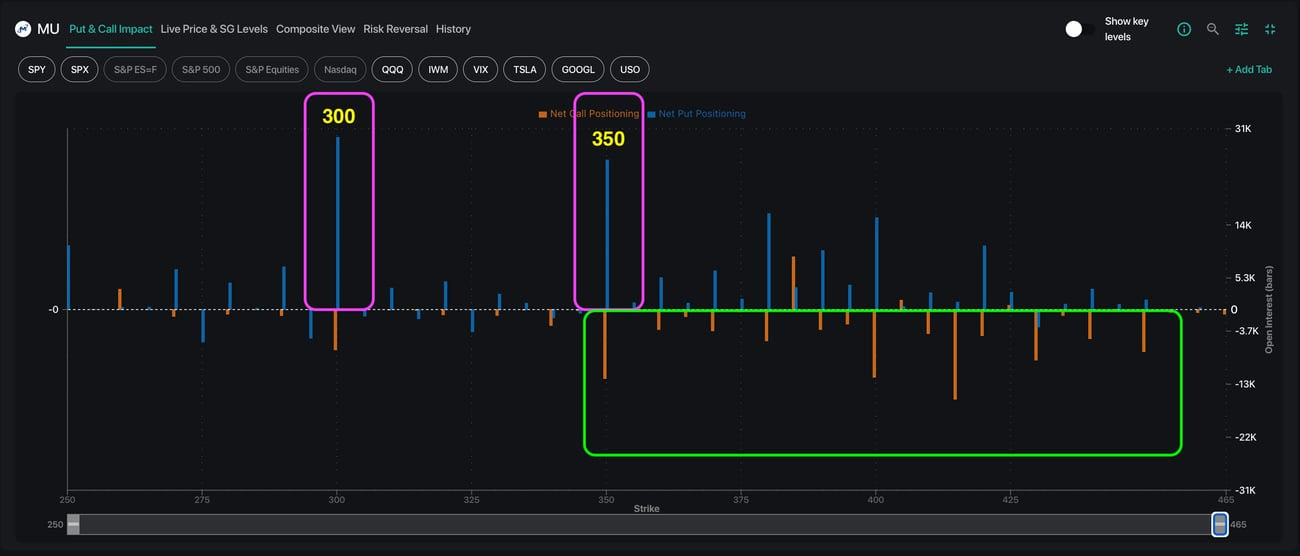
Given the large positioning, the MU 350 level would be expected to act key support level. At the same time, traders are long call structures from 350 to 450, indicating at least some bullish positioning. Note that selling puts in this environment, even through cotained-risk positions, is not for the faint of heart.
Whatever trades you may be entertaining, we leave with this simple playbook: respect the volatility regime, size risk appropriately, and know that any price move—rally or selloff—can cascade quickly.