August closed with robust corporate earnings, and nowhere was that clearer than in the AI trade stocks. Last week’s standout report came from Dell (DELL), which jumped 16% after beating estimates and raising guidance.
Dell is a leading server provider for AI data center infrastructure. Its results echoed what Nvidia (NVDA) showed a week earlier: AI infrastructure demand remains strong, boosting bullish options positioning across the broader market.
Heading into a catalyst-packed September, upcoming risk events include CPI on 9/11, the FOMC on 9/16, and quarterly triple witching OPEX on 9/18. While these dates bring the potential for market volatility expansion, dips in these AI names could find likely support based on the current options positioning.
Call Skew Runs Hot Across AI Names
Following earnings season, bullish sentiment has reignited across the AI sector. Options positioning across the data center complex remains heavily tilted toward calls as traders bid for continued upside.
In SpotGamma Compass, DELL, SMH, MU, SNDK, AVGO, and BE all show call skew percentiles above 80, with put skew below 20. This indicates rich call-side options and relatively cheap put-side options, reflecting strong demand for upside exposure.
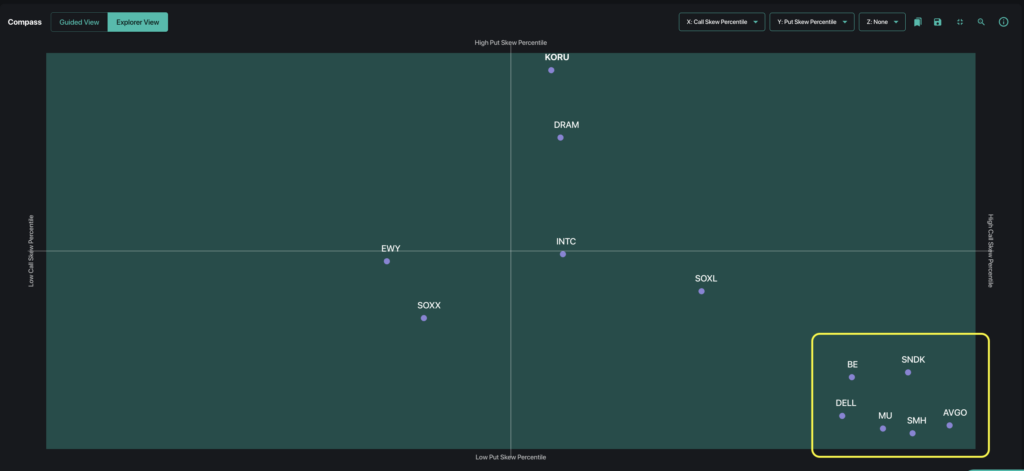
These same names have also led the broader rally, which cuts both ways. If markets come under pressure around September’s catalysts, leading AI stocks may be hit hardest. For traders, this raises the question of whether it’s worthwhile to participate in the upside frenzy — and if so, how to best position for a rally.
The answer, of course, remains dependent on the fundamentals of each stock and the weight of upcoming catalysts. However, turning to options positioning and key levels can provide useful context for assessing each individual name.
Within this group, Micron (MU) brings one of the more constructive dealer gamma profiles. MU gamma exposure shows notable supportive positioning around the 700 and 800 level, with significant negative gamma building towards the 1,000 strike.
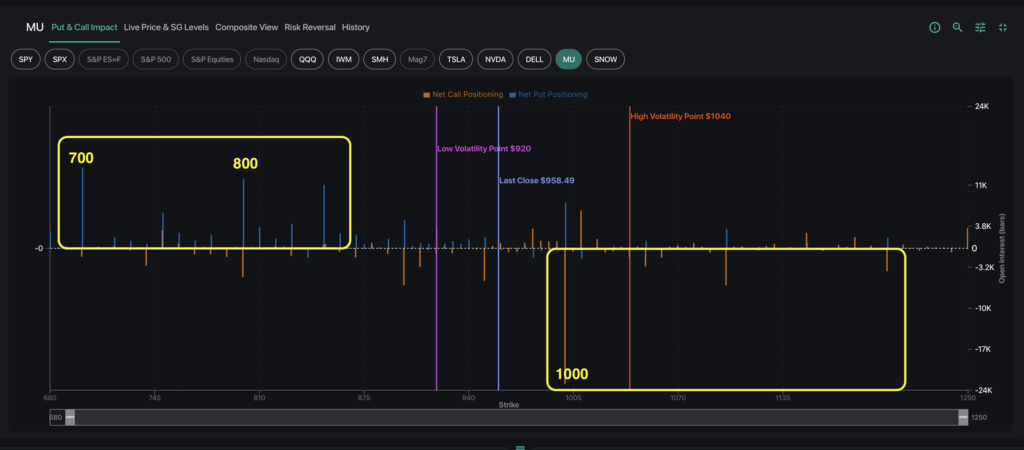
Positive dealer gamma indicates an area where lower realized volatility is expected. Negative dealer gamma is associated with higher expected realized volatility.
This scenario is one we have observed before over the summer: negative gamma to the upside could accelerate a rally in the stock, while positive gamma below creates support in MU. To optimize for these potential scenarios, long call spreads present a defined-risk structure for expressing a bullish view.
What’s the Advantage of Call Spreads Over Calls?
Compared with outright calls, a bull call spread is a vertical structure consisting of two calls – a long and short strike – with the same expiration. Here, we use the SpotGamma Options Calculator to visualize the trades and compare the potential P&L of different structures.
The below image shows the MU October 1,000 long call versus the October 1,000/1,200 call spread. With MU’s next earnings report scheduled for September 30, we project the potential P&L of both trades as of September 29 for comparison.
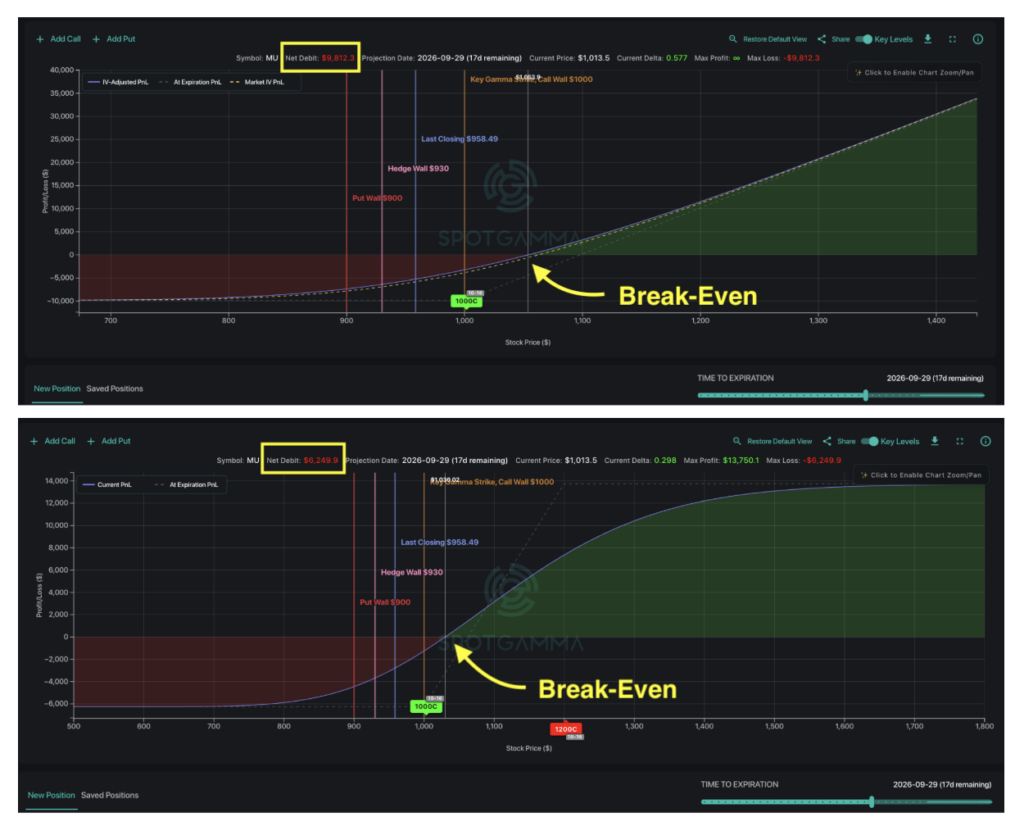
Call spreads carry structural advantages over outright calls, yet with lower upfront cost. Selling the higher-strike call offsets part of the cost of the long call —potentially reducing the initial debit substantially, depending on strike selection.
Long call spreads mean less capital at risk, a lower breakeven point, and less theta decay compared to a single-strike long call. The short call’s time decay works in the trader’s favor, partially offsetting the decay of the long call should the upside not materialize.
The key trade-off for this structure is that the short call caps the upside. On an exceptionally large move, an outright call keeps gaining. The spread reaches its maximum payout once the stock trades above the short strike at expiration, making strike selection critical.
Whichever names or strategies chosen, we encourage traders to watch the upcoming calendar with respect to both FOMC and September’s triple witching OPEX. With current odds of a rate increase above 50%, volatility certainly has room to leap from current lows. That statement applies to both the AI trade, and the broader market.