Delta Air Lines (DAL) reports third-quarter earnings before the market opens Friday, October 9, with investors watching whether strong premium travel demand can continue to offset rising fuel costs.
The setup is particularly interesting because expectations have already moved lower. Wall Street is looking for roughly $1.90-$1.92 in adjusted EPS, below Delta’s prior guidance range of $2.00-$2.50. That lowers the earnings hurdle. But for the stock, the bigger catalyst will likely be what management says about margins, fuel costs and Q4 demand.
What the Options Market Is Pricing
DAL options are pricing roughly a 6–7% earnings move, putting the near-term expected range around:
Upside: $88-$89
Downside: $77-$78
With DAL trading near $83, that is a meaningful move and suggests traders are preparing for more than a routine earnings reaction.
This also creates several clear levels to watch.
A move above roughly $85-$86 would put DAL through its first major resistance area and could open the door toward the options-implied upside near $89.
On the downside, $80 is the key psychological level. A clean break below it could quickly bring $77-$78 into play.
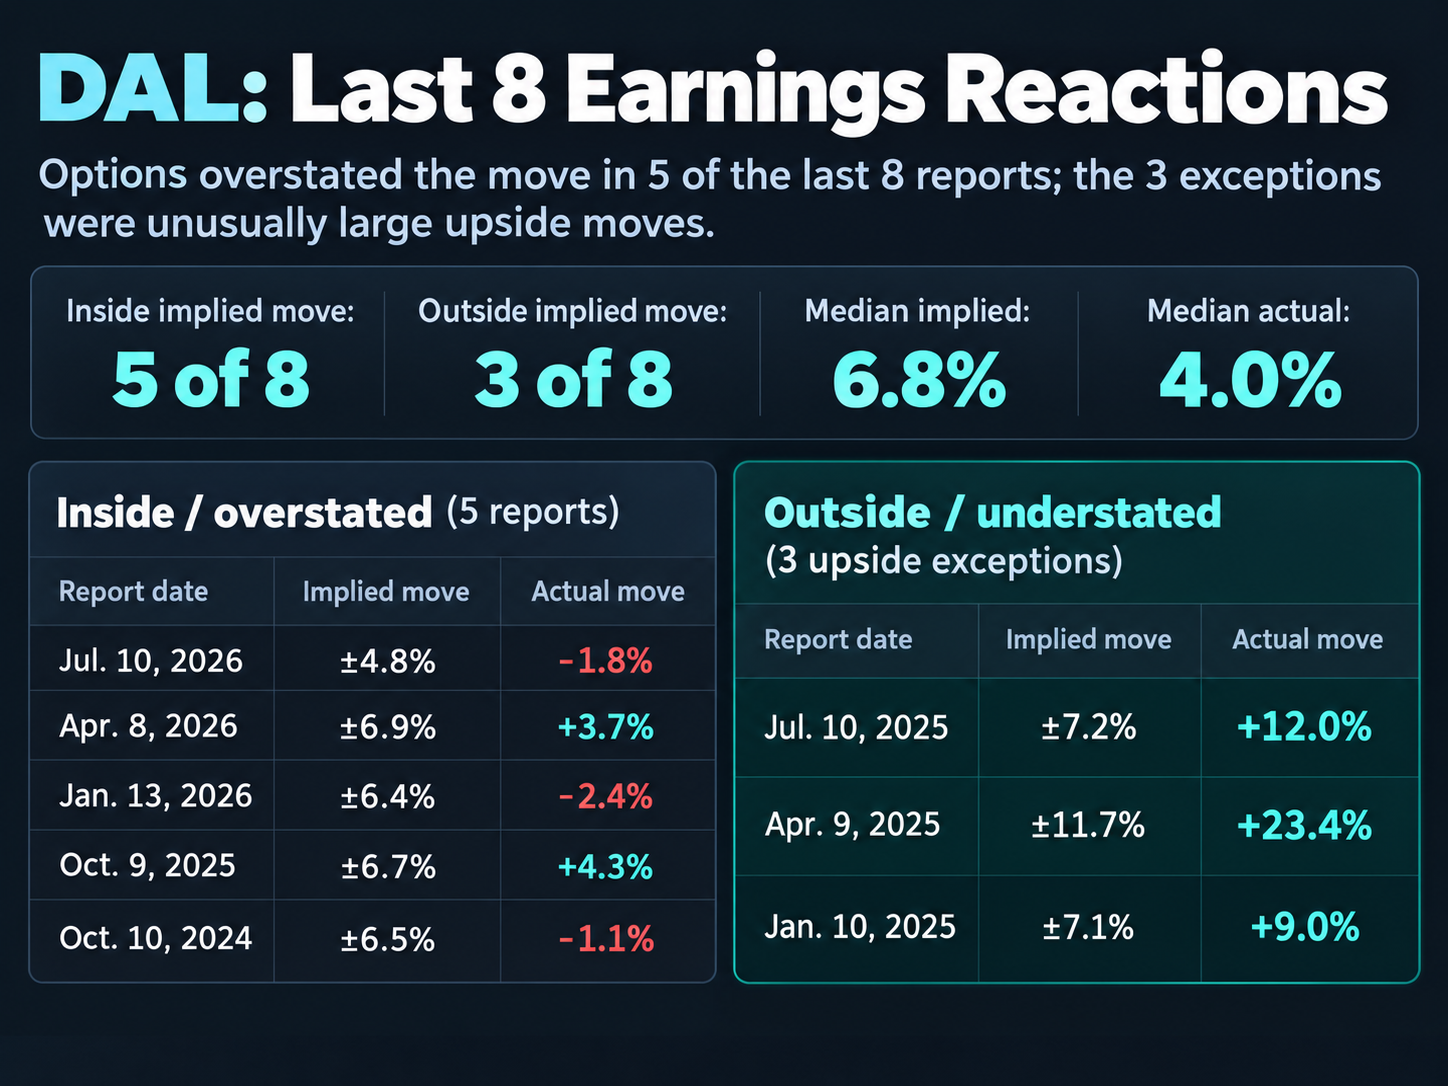
Over the last eight earnings reports, DAL stayed inside its implied move five times. The median actual move was roughly 4% versus a median implied move near 6.8%, suggesting options have generally priced more volatility than the stock ultimately delivered. The exception has been occasional large upside gaps, including +12% and +23.4% moves in 2025.
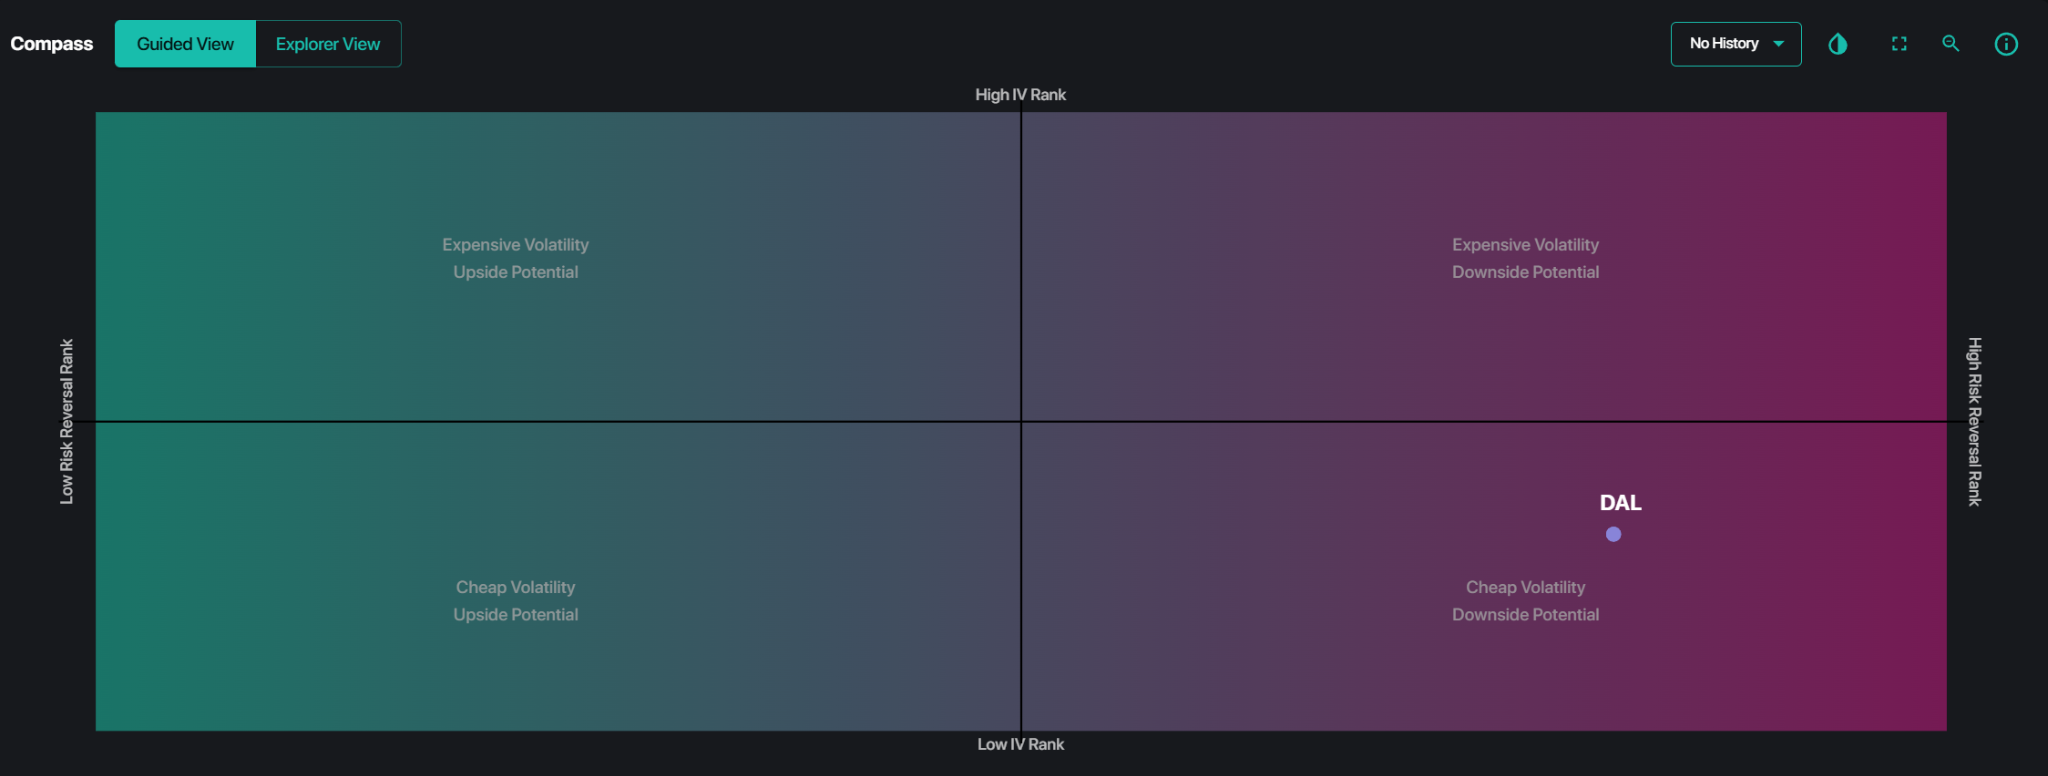
SpotGamma’s Compass places DAL in the lower-right quadrant, reflecting relatively inexpensive volatility with elevated skew rank suggesting downside potential. IV Rank near 32 suggests DAL volatility is relatively inexpensive compared with its own recent IV history, although the current earnings move remains larger than the median realized move over the past eight reports.
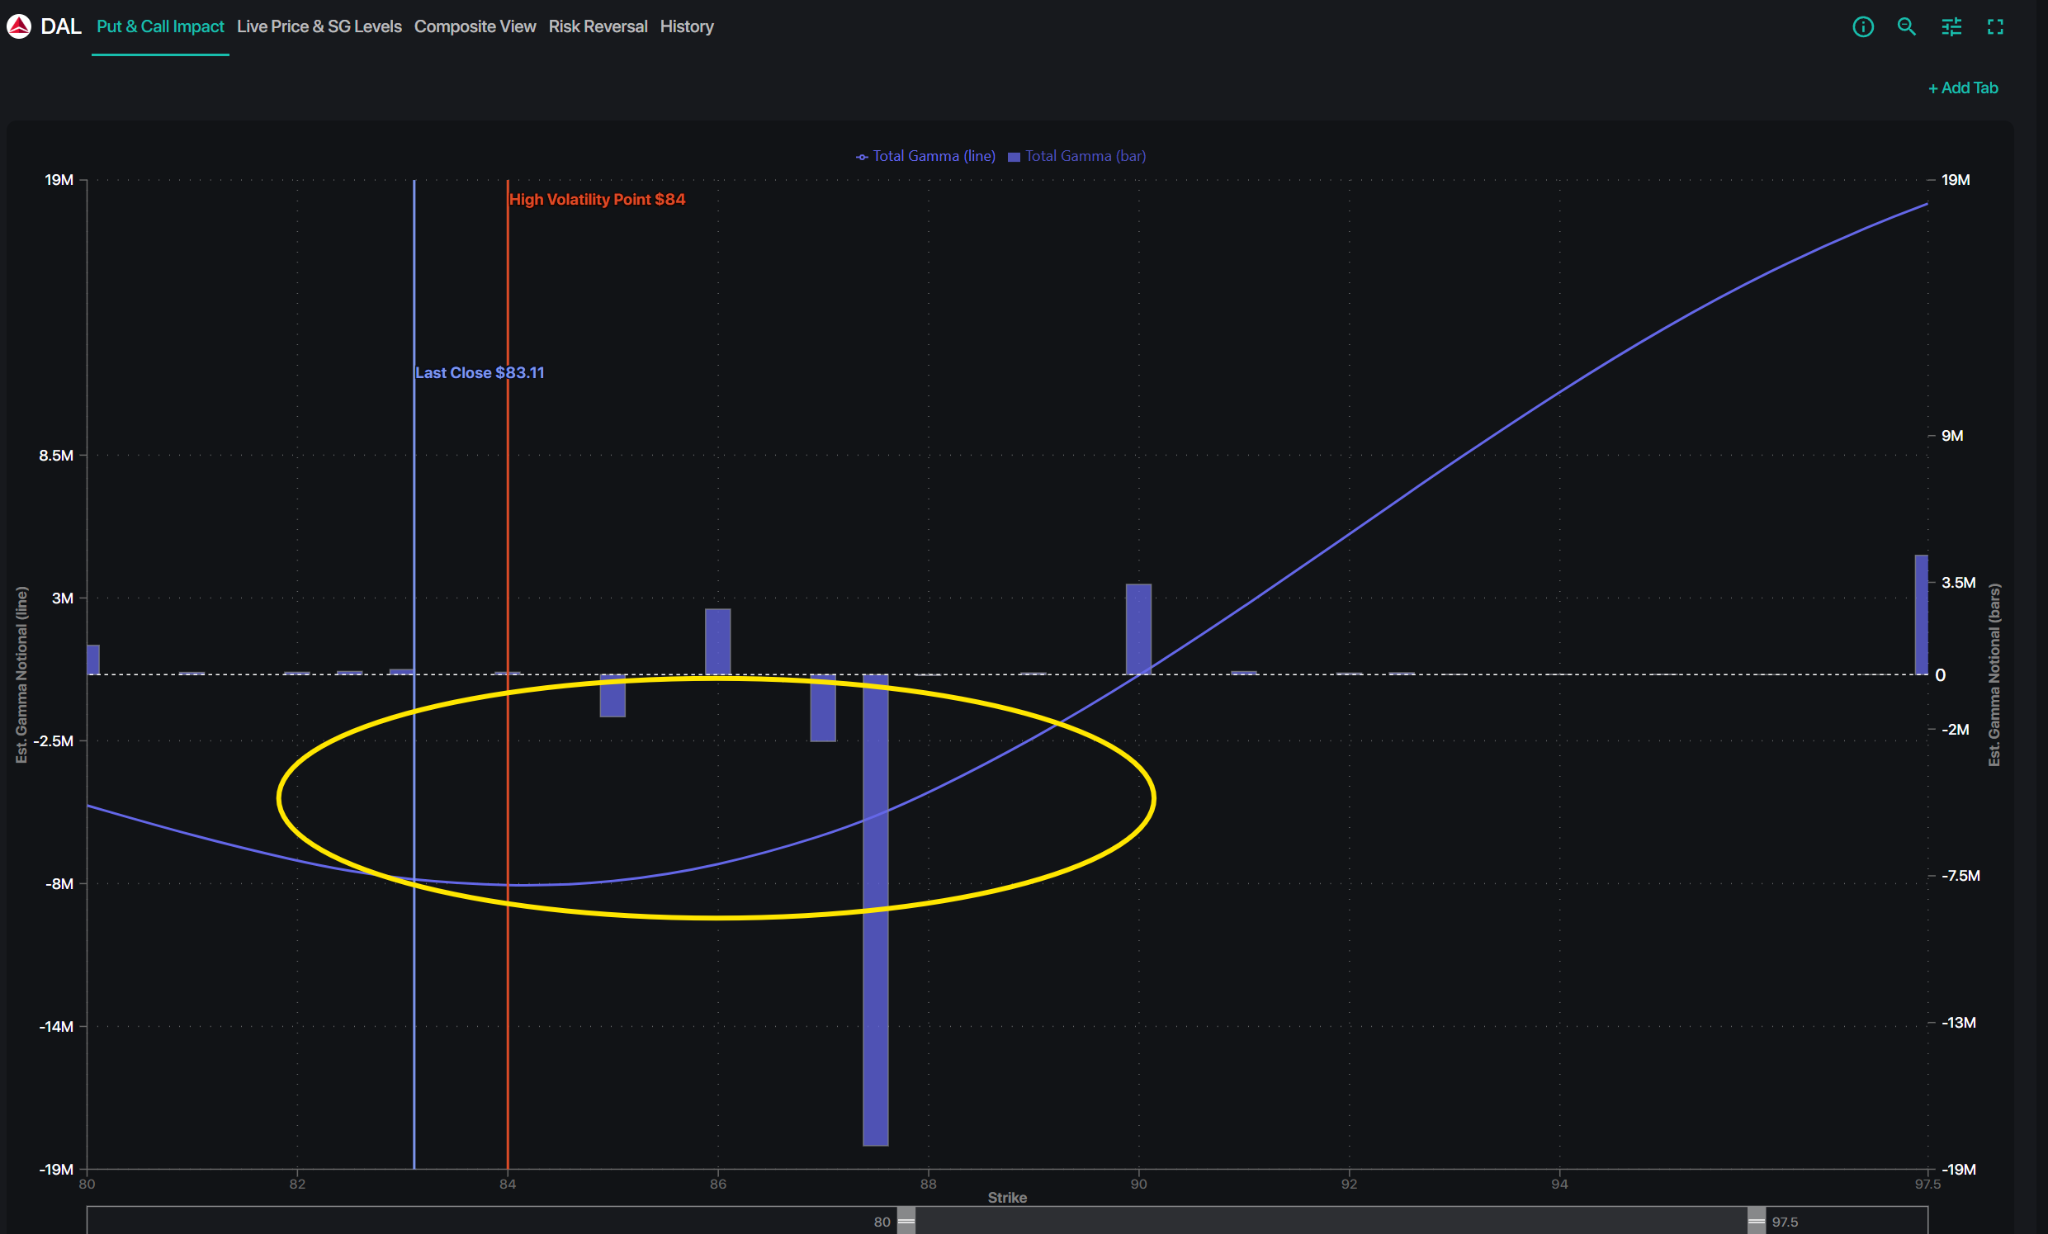
DAL is also trading in a negative-gamma environment, which can amplify moves following the report. The largest nearby gamma concentration sits around $87.50. A break through that area could leave relatively little resistance into $90, while failure to reclaim it would keep the stock contained near its current range.
For options traders, elevated event volatility matters. With a sizable move already priced into short-dated contracts, simply buying calls or puts requires the realized move to be large enough to overcome the post-earnings volatility collapse.
That makes the reaction around these key levels potentially more useful than trying to predict the initial gap.
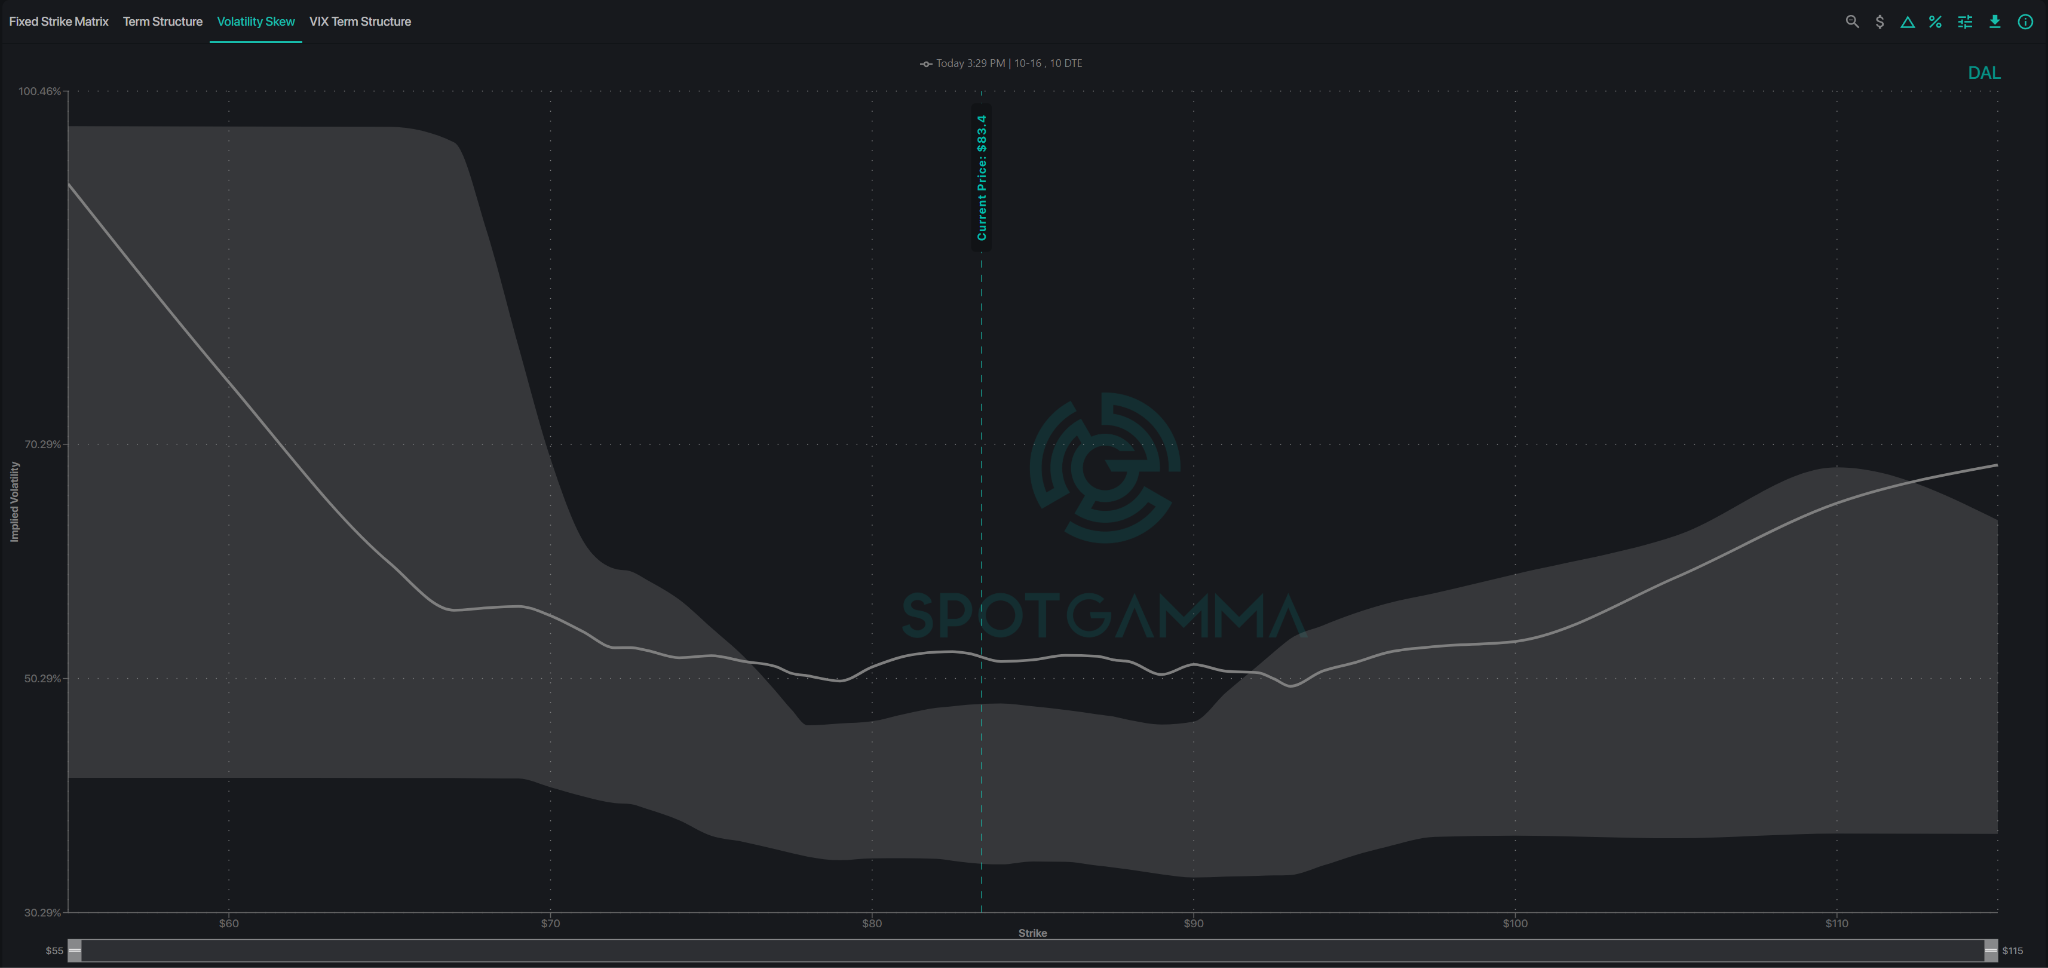
The October skew reinforces that picture. ATM IV sits near 52%, but volatility rises sharply below the mid-$70s, showing elevated demand for downside protection. The upside wing is elevated as well, but the skew is steeper to the downside. In other words, the market isn’t necessarily forecasting a selloff—it is simply charging considerably more to insure against one.
Earnings Scenarios & Key Levels
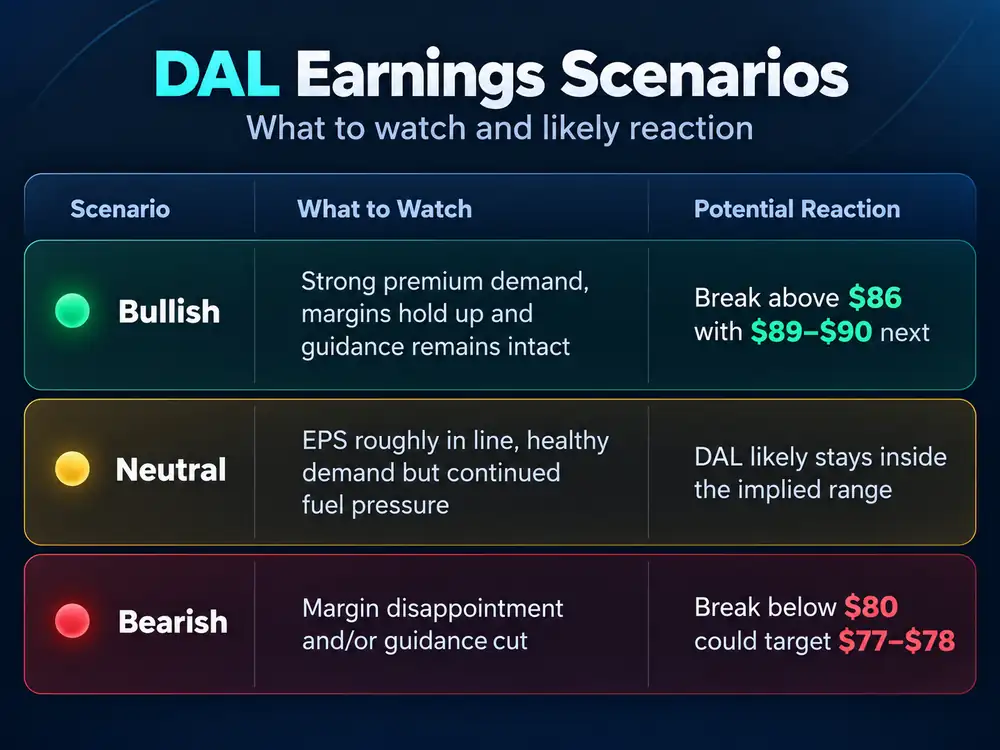
What Could Move the Stock
Delta’s operating backdrop remains healthy. Premium revenue rose 17% last quarter, corporate sales remained strong and the American Express partnership continues to provide a valuable high-margin revenue stream.
The risk is costs. Higher fuel prices are pressuring margins, making Delta’s prior 11%-13% Q3 operating-margin guidance more important than the headline revenue number.
With consensus EPS already below Delta’s prior guidance range, investors may be willing to look through a modest earnings miss if management maintains its broader outlook. A guidance cut tied to fuel costs would be much harder to dismiss.
Options Trader Takeaway
DAL enters earnings with expectations already reduced and overall volatility relatively inexpensive, but with investors paying a clear premium for downside protection. Negative gamma could amplify the post-earnings reaction, making the $87.50 gamma node and the $80 downside level particularly important.
Fundamentally, the report comes down to whether strong premium demand can continue to offset rising fuel costs. If Delta can defend margins and maintain guidance, the lowered earnings bar creates room for upside. A guidance cut would put the downside skew—and the market’s demand for protection—squarely in focus.
Potential Trade Structure
DAL’s recent earnings history has shown an interesting upside asymmetry: all three moves that exceeded the options-implied range were rallies. That doesn’t guarantee another upside surprise, but it makes a defined-risk bullish structure worth considering.
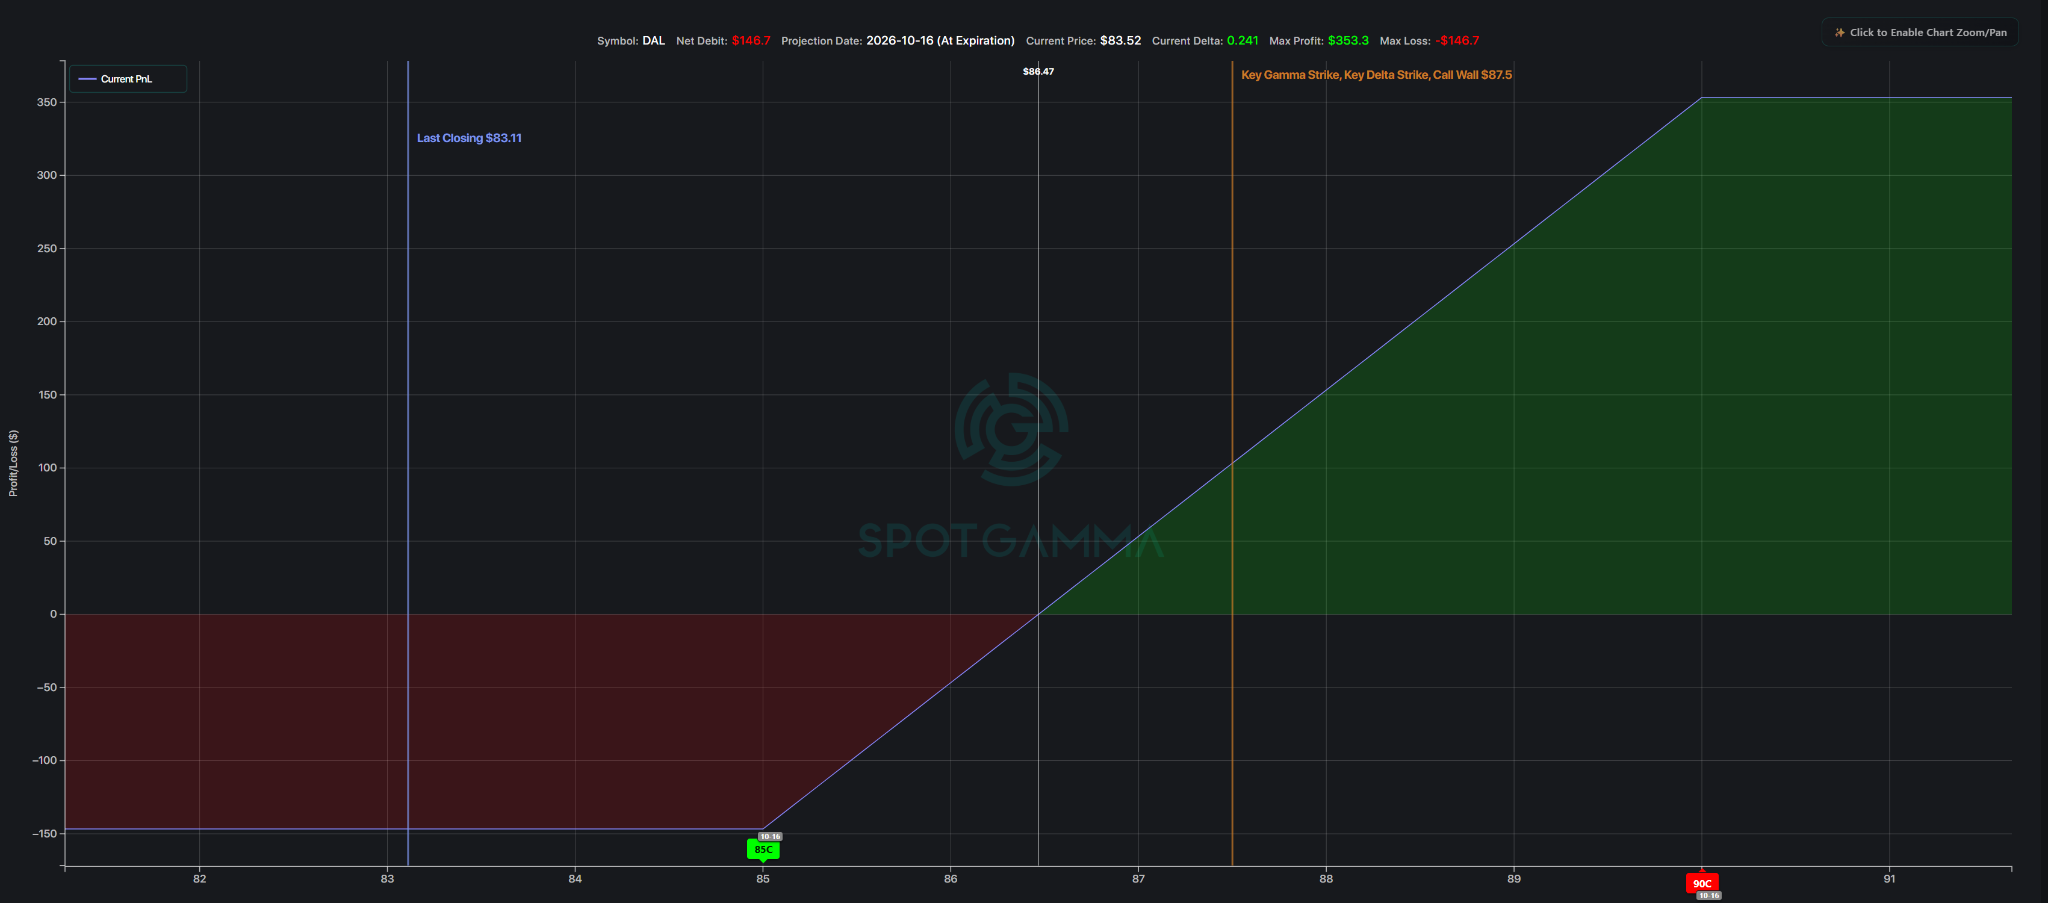
With DAL trading just under $84 Tuesday, the October 16th $85/$90 call spread was offered around a $1.45 debit. At that price, maximum risk is $1.45, maximum potential profit is $3.55, and the expiration breakeven is $86.45.
The $90 short strike also sits near both the upper end of the current options-implied range and the next major level above the $87.50 gamma concentration. That gives the structure a logical target while avoiding the higher premium of an outright call purchase.