Apple (AAPL) heads into its fiscal fourth-quarter earnings report Monday evening (November 2) trading near all-time highs, with expectations elevated for its latest iPhone cycle, Services growth, and the critical holiday shopping season.
The options market is pricing approximately a 4.3% earnings move based on the ATM straddle cost estimate, noticeably larger than Apple’s typical historical reaction. With shares around $345, the question for traders is whether the elevated volatility premium offers an opportunity for premium sellers or signals a potentially larger directional move.
1. What the Options Market Is Pricing
Based on October 30 closing data, Apple’s November 4 options reflect a substantial earnings-related volatility premium.
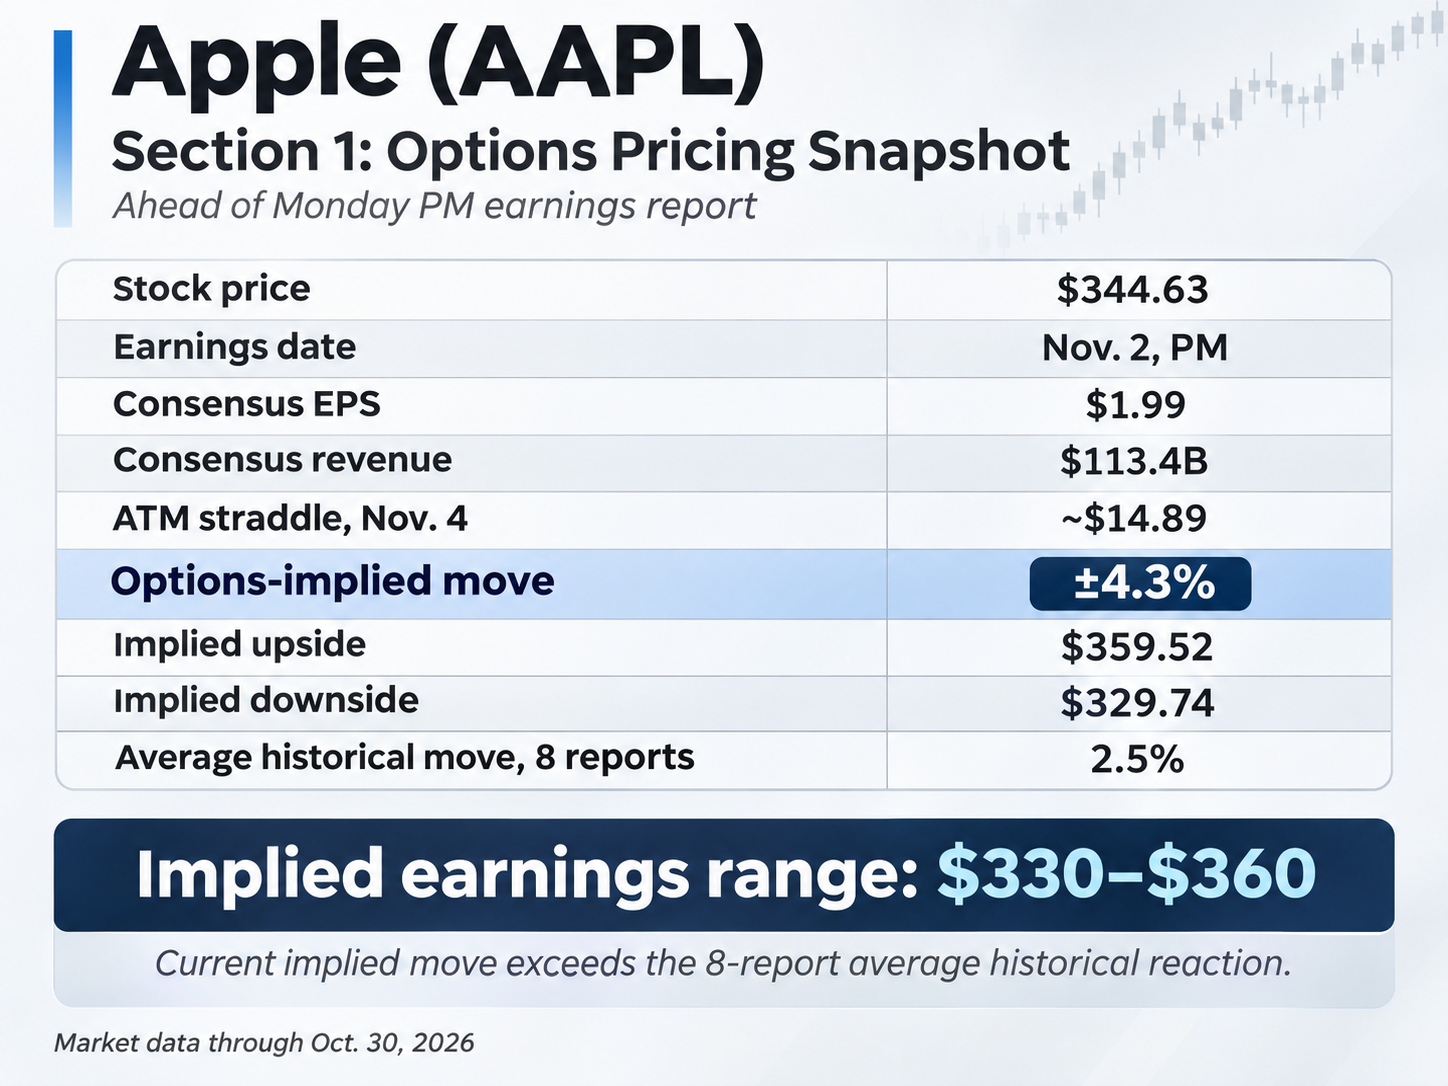
The $345 at-the-money straddle represents roughly $14.90 in expected movement through Wednesday’s expiration. That establishes an approximate $330-$360 implied trading range around the announcement.
However, Apple’s historical earnings reactions have generally been considerably smaller.
Recent post-earnings moves:
- July 2026: -7.3%
- April 2026: +3.2%
- January 2026: +0.5%
- October 2025: -0.4%
Across the previous eight reports, Apple’s average absolute earnings reaction was approximately 2.5%, with only one exceeding the 4.3% move currently priced.
Apple’s unusually large July 2026 earnings decline was driven primarily by disappointing forward guidance rather than weak quarterly results. Despite a revenue and earnings beat, management warned of worsening semiconductor supply constraints, rising memory costs, and weaker-than-expected September-quarter growth. Services and China revenue also missed expectations, reinforcing concerns about future profitability.
The takeaway for Monday: Even strong headline results may not protect AAPL from a sharp selloff if holiday-quarter guidance disappoints.
One additional consideration: November 4 options also span Tuesday’s midterm elections, potentially adding macro-related volatility premium beyond Apple’s earnings announcement alone.
Options takeaway: Implied volatility looks relatively expensive compared with historical realized earnings moves. That creates an interesting statistical backdrop for premium sellers, although July’s sharp downside reaction demonstrates why defined-risk structures remain important.
2. Volatility Skew: Downside Protection Remains Expensive
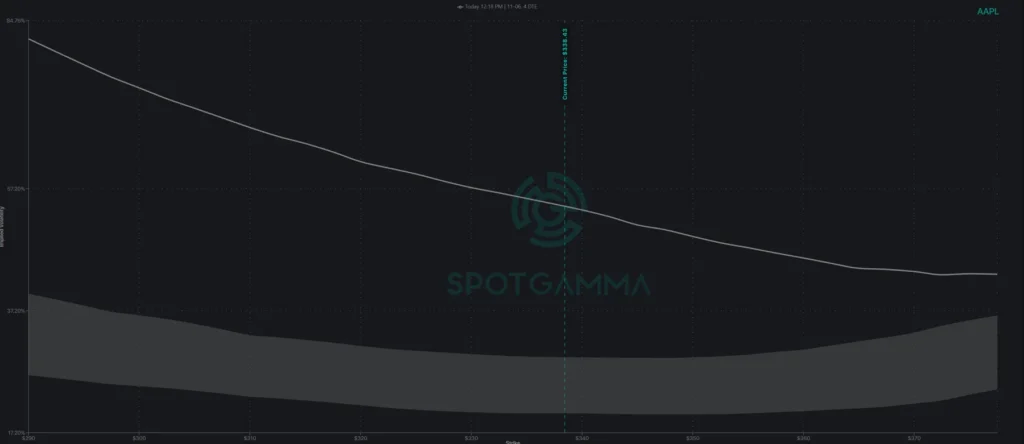
Apple’s latest SpotGamma volatility skew chart shows a pronounced downside put skew, indicating investors are paying significantly more for downside protection ahead of earnings.
For the November 27 expiration, implied volatility rises sharply toward lower strikes, exceeding 35% near $300, compared with roughly 29% around the current $344.79 share price. Upside strikes near $380 carry considerably lower IV around 25%.
This steep downward slope reflects stronger demand for protective puts than upside calls, suggesting investors remain cautious despite Apple’s elevated share price.
Options takeaway: Rich downside put premiums may create opportunities for defined-risk put credit spreads. However, the pronounced skew also highlights meaningful downside hedging demand, making strike selection and risk management particularly important ahead of earnings.
3. Dealer Gamma Positioning: Key Levels to Watch
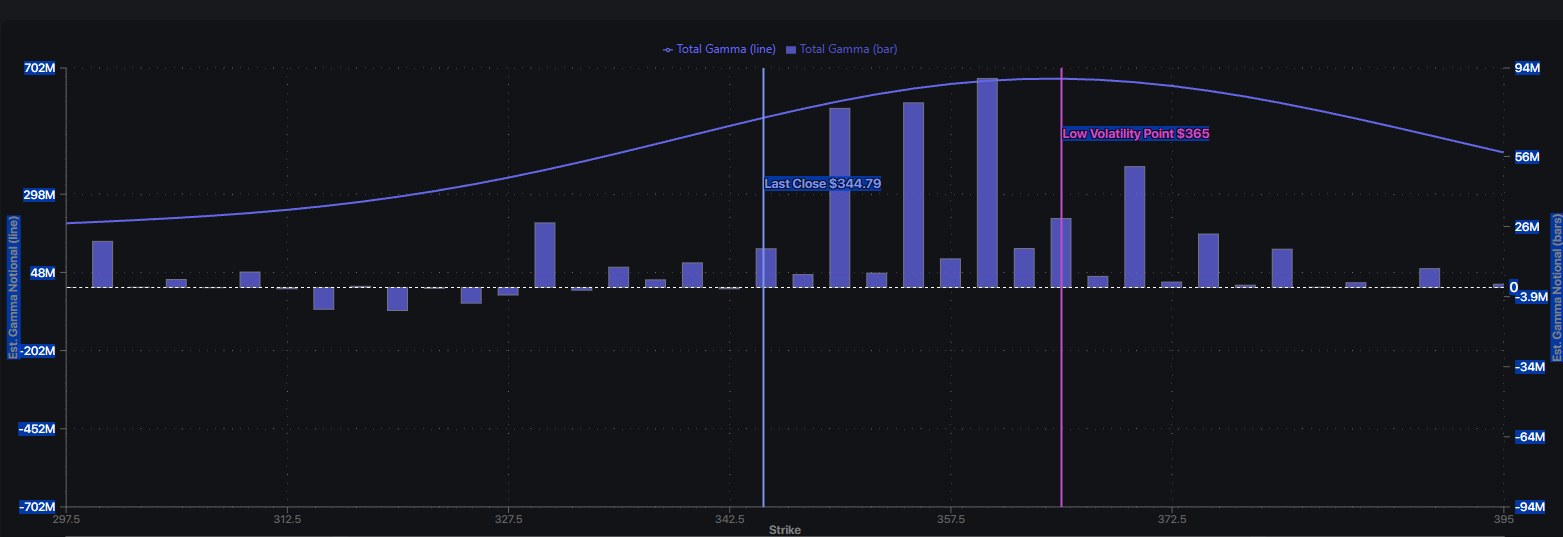
Apple’s latest SpotGamma Synthetic OI map shows substantial positive gamma concentrated between $350-$365, just above the current stock price of $344.79.
The largest gamma concentrations appear at $350, $355, and $360, potentially creating a volatility-dampening zone where dealer hedging may help contain price swings.
SpotGamma identifies $365 as the Low Volatility Point (LVP), suggesting an important upside reference beyond Apple’s $330-$360 earnings-implied range.
Below spot, gamma exposure is noticeably thinner, particularly between $330-$340, potentially allowing greater downside volatility if earnings disappoint.
Options takeaway: Positive gamma positioning above spot could favor volatility sellers if Apple’s earnings reaction remains contained. However, a break below $340 could encounter less stabilizing dealer positioning, while a sustained rally through $360 would bring the $365 LVP into focus. Earnings gaps can overwhelm pre-event gamma positioning.
4. Fundamental Catalysts: What Matters Most?
Three developments could determine Apple’s post-earnings reaction:
iPhone demand and product momentum
With quarterly iPhone revenue estimates near $56.4 billion, investors will focus on iPhone 18 demand, upgrade activity, and performance in Greater China.
Services growth and margins
Services revenue expectations are near $31.7 billion. Sustained growth and healthy margins remain critical to supporting Apple’s premium valuation.
Holiday-quarter outlook
Perhaps the biggest catalyst is management’s fiscal Q1 2027 guidance, with revenue estimates near $153 billion. Commentary on holiday iPhone demand, AI adoption, component costs, and supply constraints could outweigh the September-quarter results.
Bottom line: With expectations elevated, even a solid earnings beat may disappoint investors if holiday guidance falls short.
5. Post-Earnings Scenarios and Trading Implications
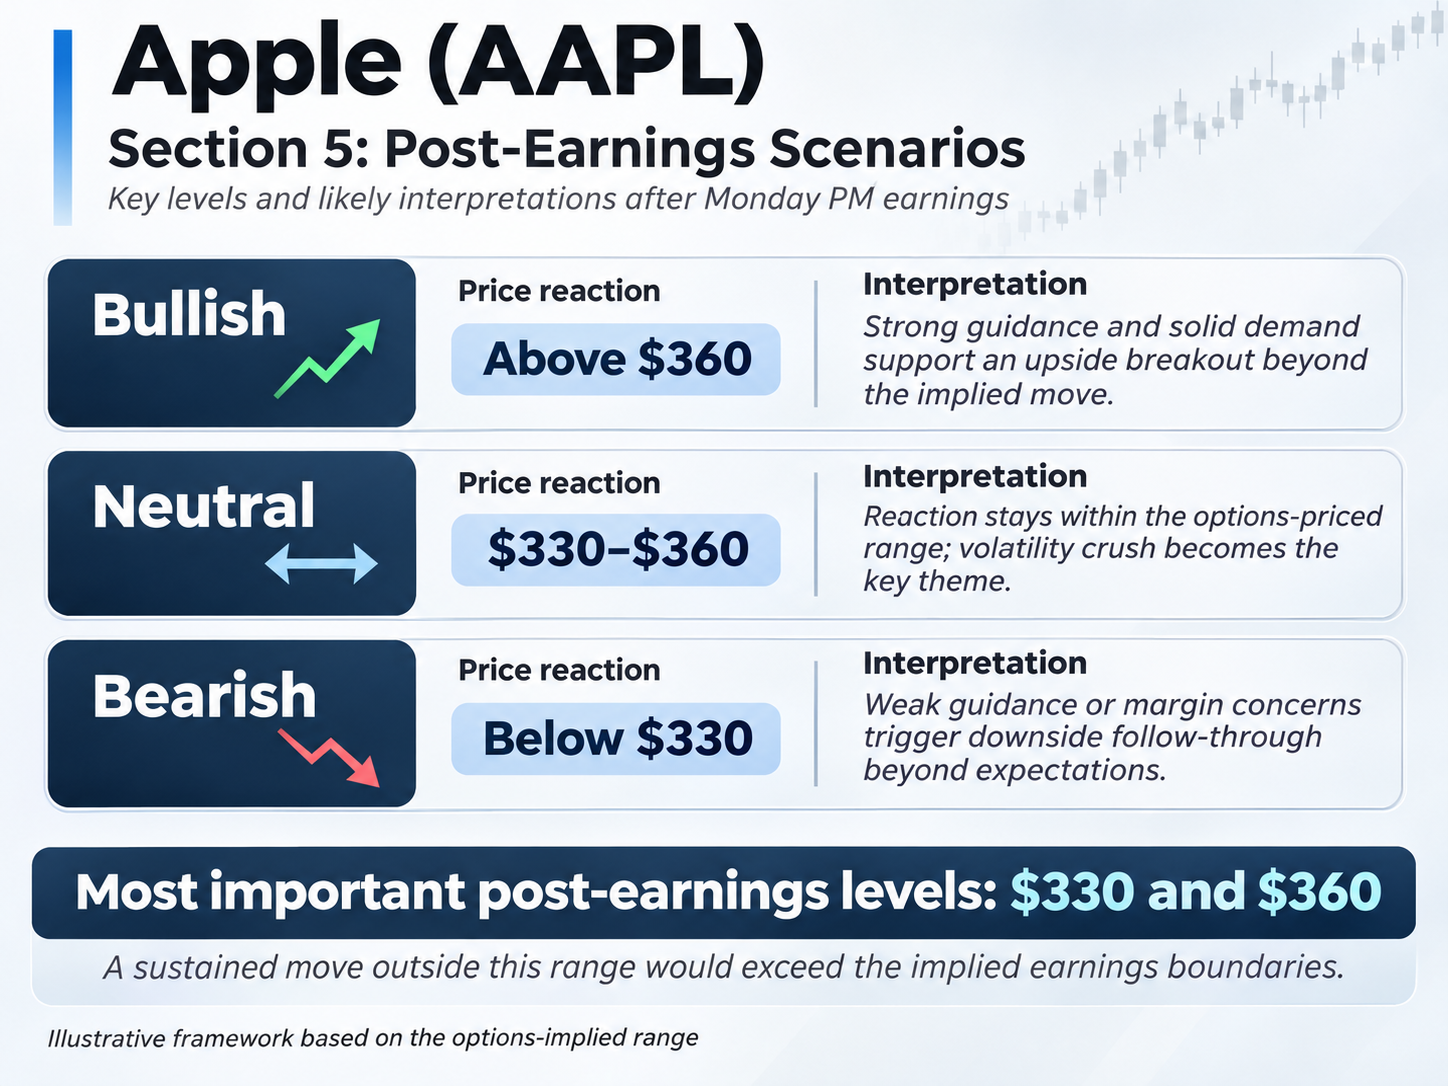
Bullish scenario: Strong iPhone demand, resilient Services growth, and encouraging holiday guidance could support a breakout through $360. Traders should watch for sustained buying rather than an initial opening gap that quickly fades.
Neutral scenario: An earnings reaction contained within the expected range could favor volatility sellers as event-related implied volatility collapses. Price acceptance around $340–$350 could reinforce a more balanced post-earnings environment.
Bearish scenario: Disappointing holiday guidance or margin concerns could push shares below $330. A break below $340 would push shares into a thinner gamma region, potentially accelerating downside momentum toward or beyond the $330 implied boundary.
An Options Strategy Worth Considering: Defined-Risk Iron Condor
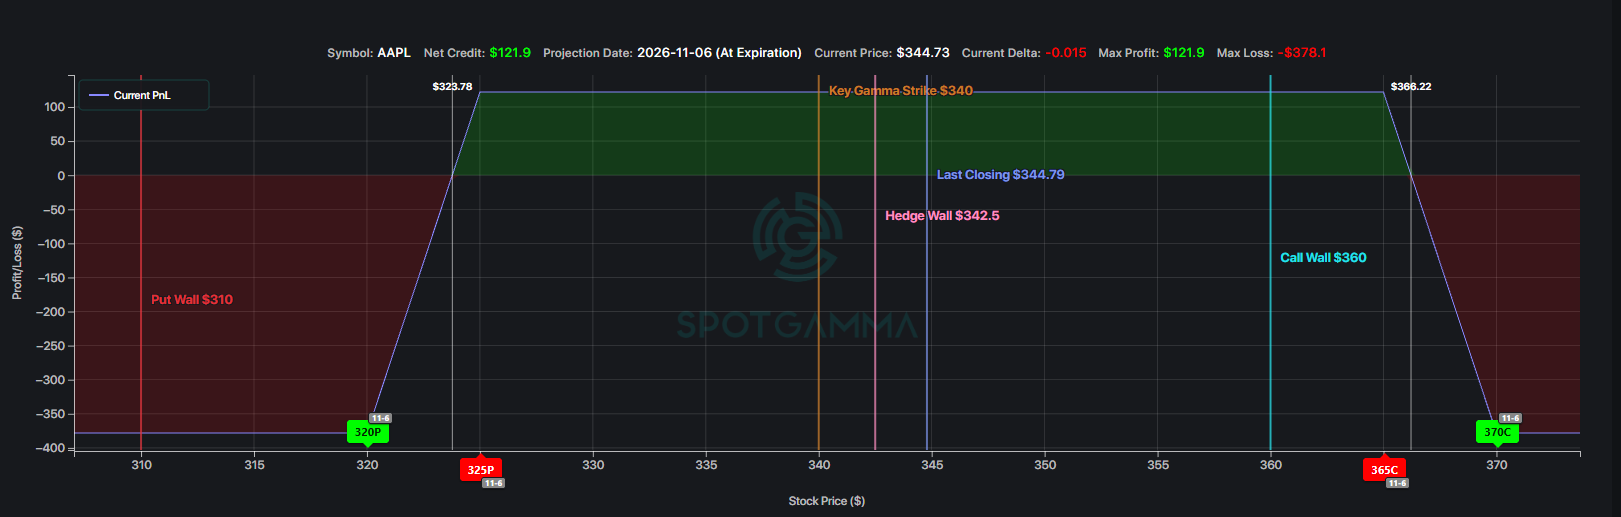
For neutral traders, a November 6th $320/$325 put spread paired with a $365/$370 call spread offers a way to capitalize on elevated earnings volatility.
This structure positions both short strikes outside Apple’s $330/$360 implied earnings range, while the substantial positive gamma concentration between $350/$365 could help contain post-earnings price movement.
The relatively rich downside put skew helps support premium collection, although thin gamma below spot presents an important downside risk.
Based on October 30 pricing, the iron condor offers approximately $120 in maximum profit against $380 in maximum risk per spread. Actual entry pricing may differ.
Traders could look to capture an early volatility contraction rather than holding through expiration.

Final Thoughts
Apple’s 4.3% implied earnings move exceeds its historical average, creating an interesting opportunity for defined-risk volatility sellers, though outsized reactions remain possible.
The key levels are $330 and $360, with $340-$350 providing an intermediate positioning reference.
Ultimately, holiday-quarter guidance could matter more than the headline results. For options traders, the opportunity lies in determining whether the actual reaction justifies the elevated volatility premium.