Several major tech earnings missed last week, sparking the market’s worst selloff since June. Disappointing results and swelling AI capex concerns drove the Nasdaq 100 down 6% in two days, with the S&P dropping 1.8% on Friday alone. The Binance hack on Thursday added more fuel to the fire.
Traders are now left wondering if the AI bull market is over, or if this is just a violent reset.
The single-stock damage told the story. GOOGL plunged a record 13% after reporting on Wednesday — its worst day since going public in 2004. Traders fear its AI spending has pushed free cash flow negative. INTC fell roughly 30% after its outlook missed estimates, the stock’s largest single-day decline in decades.
One thing is now clear: this market no longer rewards AI spending on faith. Investors seek proof that capex can convert into meaningful cash flow.
Earlier last week, warning signs began to surface through options positioning. We issued the following warning in our pre-market Founder’s Note on Thursday:
“If we lose 7,690 and tech is again wrecking, and if rates creep higher, we may finally see -2% (or larger) SPX declines as the rotation trade loses its luster…We like Nov or Dec put spreads in SPY, and outright puts in IBIT.”
That 7,690 level is our Risk Pivot: the point below which our S&P model flips to risk-off. Once SPX broke below this level, dealer selling accelerated as negative gamma picked up. As SPX closed below 7,600 on Friday, we remain wary of a possible drop towards 7,400, where negative dealer gamma peaks.
What Does Options Positioning Now Reveal?
Despite the market selloff, options positioning suggests de-risking rather than outright fear. SpotGamma Founder Brent Kochuba discussed both the dealer gamma regime and volatility risk in Friday’s live webinar.
Index-level call buying has slowed, but traders aren’t aggressively chasing puts either. SPY 1-month skew (roughly, the difference in demand between 25-delta puts and 25-delta calls) remains at 2.89 percentage points, below its multi-year baseline.
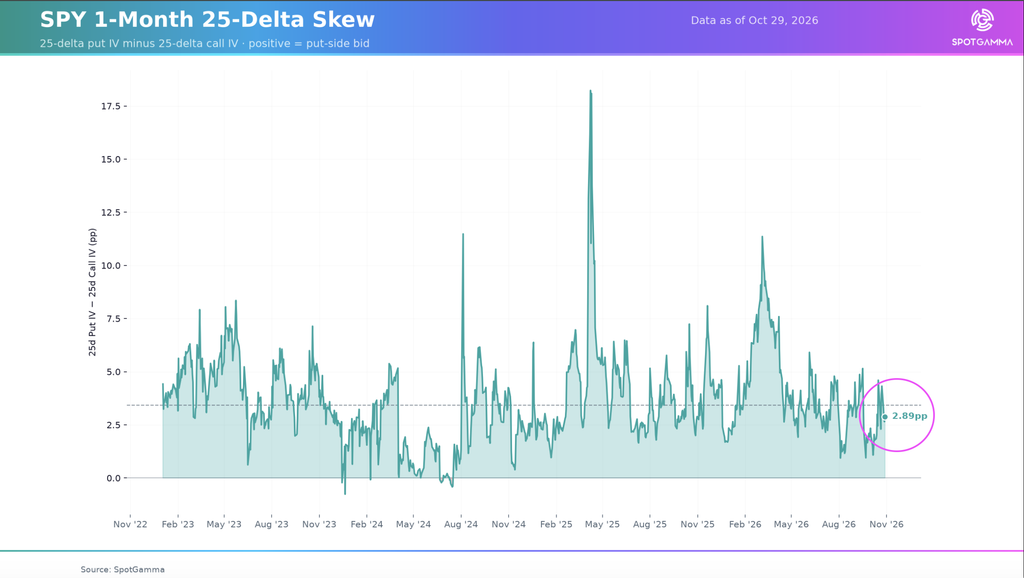
This points to a relatively compressed or “flat” skew environment rather than elevated demand for downside protection, particularly compared with the extreme skew levels seen during the market drawdowns in March 2026 and April 2025.
Interestingly, much of Friday’s decline in the S&P 500 was driven specifically by 0DTE trading. Our HIRO indicator shows that of -$8.7B in total put delta (dark blue line), the vast majority of this came from same-day puts (light blue line).
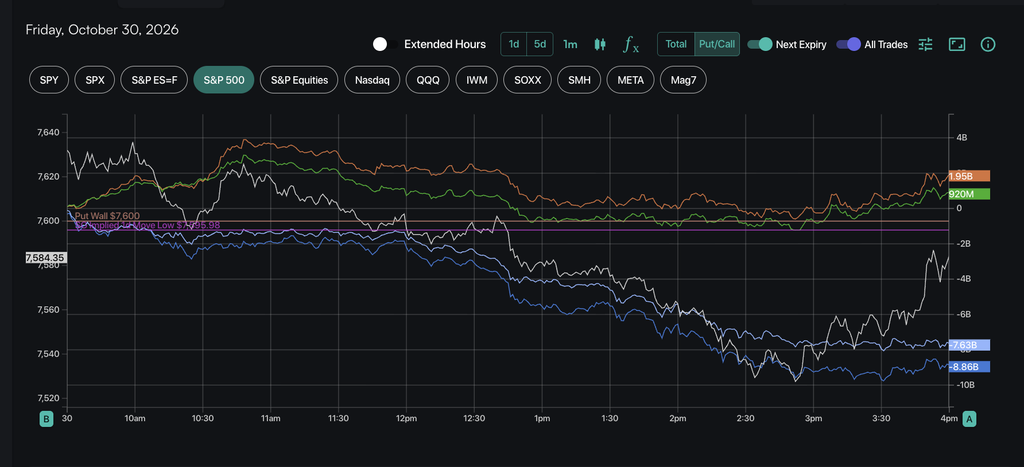
Typically, longer-dated flow indicates directional conviction vs. same-day trades. While 0DTE options hedging pressure pushed the market lower, that same hedging pressure evaporated after Friday’s expiration. We will need to wait for Monday to see how short-dated traders enter the market, and whether that is likely to reinforce a move lower — or bring back some stability to the market.
The Week Ahead: Earnings, Midterms, and NFP
The catalyst calendar next week offers little room to breathe. Apple reports earnings on Monday, November 2 — a key test of whether mega-cap tech can stop the bleeding. This is followed by the U.S. midterm elections on Tuesday, November 3, and the nonfarm payrolls (NFP) report on Friday, November 6.
Consequently, SpotGamma’s Volatility Dashboard shows that the SPX implied volatility Term Structure has shifted higher across all expirations compared with three weeks ago.
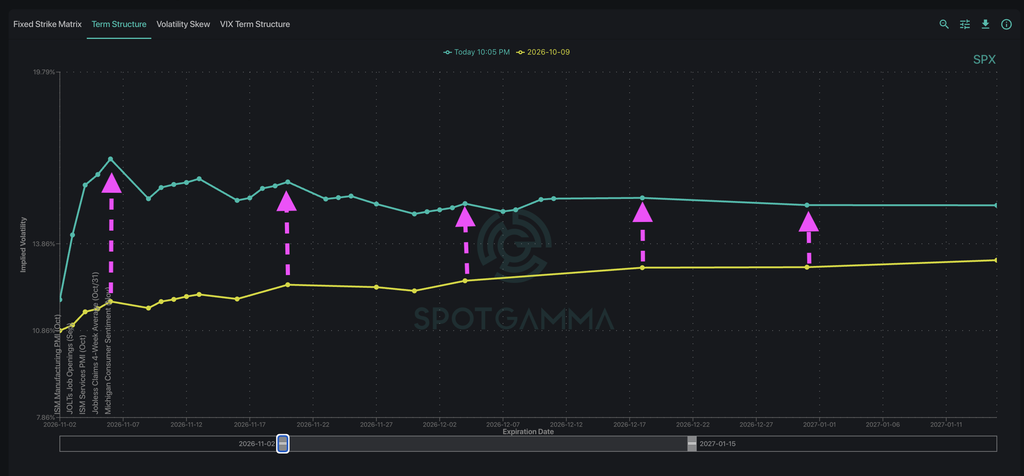
This broad elevation in implied volatility likely reflects uncertainty surrounding the upcoming events. If these risk events pass and implied volatility compresses, vanna-related dealer hedging flows could provide a tailwind for equities and spike a relief rally.
Will Gold Shine Again?
Throughout the selloff late last week, capital began rotating into defensive sectors. Consumer staples (XLP), healthcare (XLV), and utilities (XLU) all outperformed the broad market for the month.
With defensive assets already attracting flows, options positioning points to gold as another potential hedging candidate. GLD now trades near $356, roughly 30% below its previous all-time high amid rising yields.
GLD now trades near key levels at $350 and $340, where traders have sold approximately 37K and 12K puts respectively. This put-selling activity suggests those strikes could act as potential support levels.
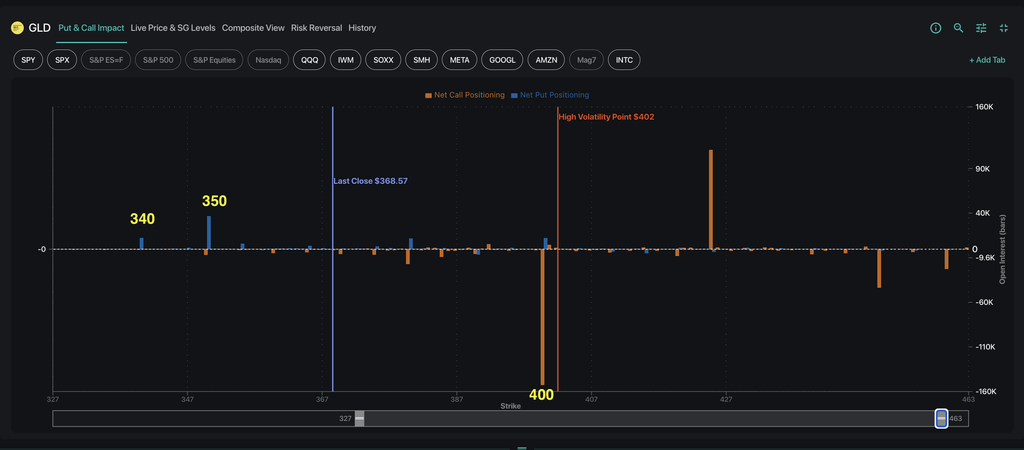
To the upside, we see a substantial 152K-contract call position at the $400 strike. That presents a roughly 2.75:1 potential reward-to-risk ratio — about 16 points of downside to the $340 support level versus 44 points of upside to $400. This could make GLD an attractive candidate on a swing-trading timeframe.
And with GLD’s IV Rank at just 8%, implied volatility sits near the low end of its one-year range, potentially making long calls an attractive way to express a bullish view with defined premium risk.