The market spent most of last week locked in the SPX 6,800–6,900 range that has largely held since Thanksgiving. Wednesday’s VIX expiration and Friday’s monthly OPEX defined the week’s rhythm, while negative gamma positioning and elevated single-stock put demand maintained pressure under the surface. Our historical OPEX data suggests the market is positioned for a bounce in the next week, as underlying fragility now extends to upside risk.
The February monthly expiration saw a relatively balanced mix of puts and calls expiring for single stocks, ETFs, and indices. Despite recent headwinds, the S&P 500 was only down ~2% from all-time highs heading into last week. As we wrote in the Friday morning Founder’s Note:
“When the SPX sells off into a ‘VIX exp first’ series, it tends to bounce after.”
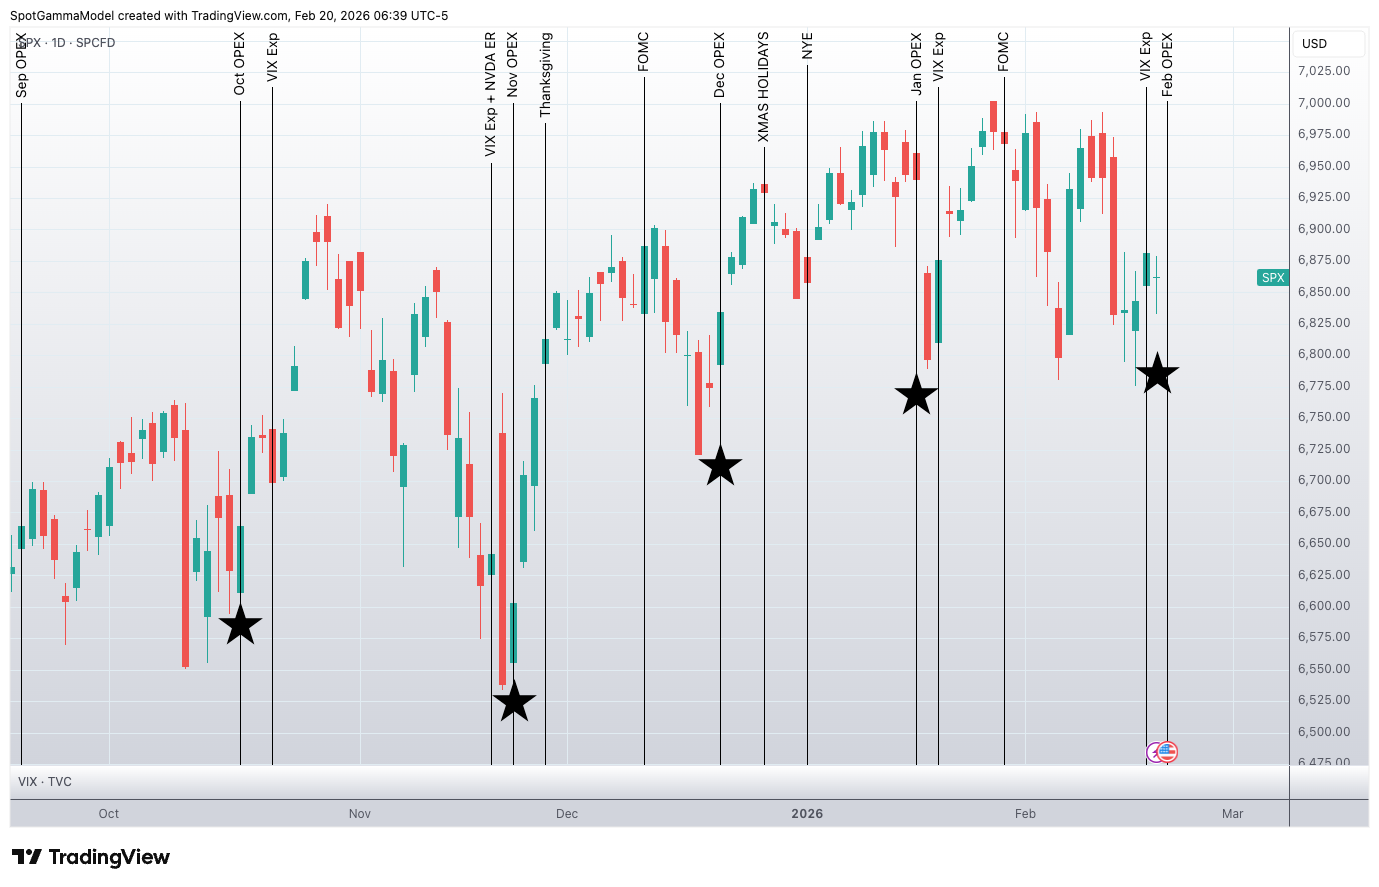
Furthermore, since November we have seen SPX 6,800 tested almost exclusively during the monthly OPEX timeframe, with a subsequent bounce each time (the stars on the chart below indicate a monthly expiration).
What Does Dealer Gamma Reveal About Upside Risk?
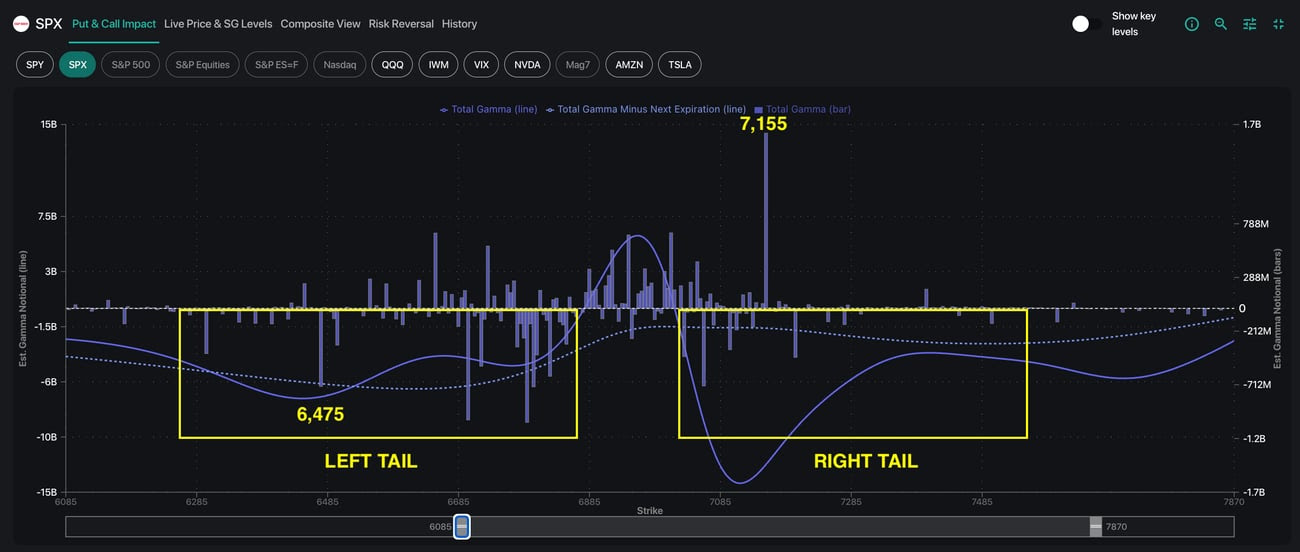
The SpotGamma Synthetic OI model sheds further light on how upside risk could occur. The dealer gamma profile reveals structural stability between 6,800 and 7,000 through positive gamma, although that flips to negative gamma both above & below this zone.
A sustained break outside of this range means dealers would need to hedge alongside price movement, increasing volatility. Our Risk Pivot now sits at SPX 6,800, which remains the key level to watch heading into next week.
Traders have heavily favored long puts to hedge the volatile conditions of the prior two weeks. As a result, put skew sits near extreme levels while call skew is near record lows. This one-sided skew dynamic makes the market vulnerable to sharp reversals.
Should upside begin to manifest in the S&P 500, long puts held by traders would decay, allowing dealers to reduce their own hedges and add further buying pressure. This combination sets the stage for a reflexive upside squeeze.
Nvidia earnings on February 25 remains the major event next week that could challenge the upside hypothesis. As NVDA now accounts for over 7% of the S&P 500 by weight, the quarterly report on Wednesday has the potential to either inflate or calm index volatility.
Asymmetric Risk-Reward Setups in Single Stocks
Single-stock dispersion remains elevated, with many large-cap names down more than 20% from January while SPX sits just 1.5% below all-time highs. This discrepancy reinforces the fragmented market theme we highlighted in last week’s Sunday note.
Our Compass tool shows put skew in many mega-cap stocks at the 90th percentile or higher, while call skew remains subdued. Traders are broadly selling calls and buying puts — a clear expression of upside skepticism.
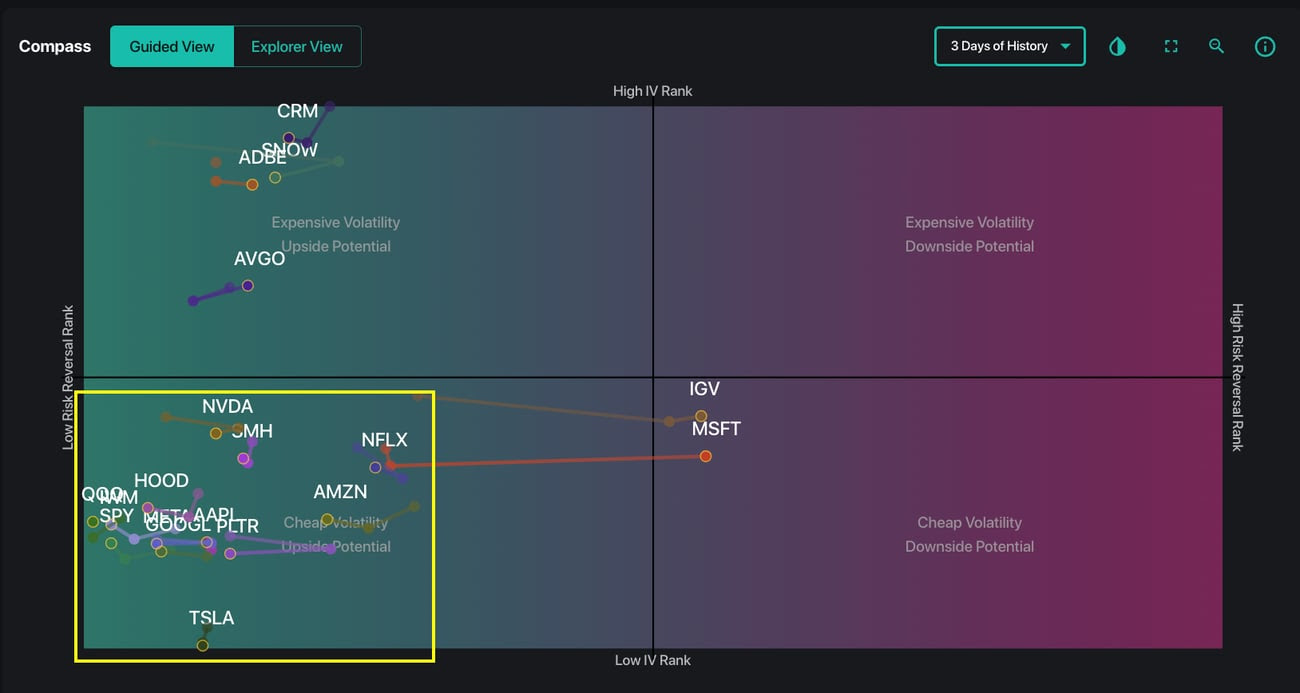
There is one last question that remains on our mind: If major indices remain near record highs and have largely traded sideways for three months, why is single-stock downside protection so persistently expensive? Whether driven by systematic dispersion trades or fundamental caution, the positioning is unusually uniform.
One major benefit of options is that they can offer asymmetric risk/reward potential — limited downside and convex upside. Heading into Friday’s close (2/20), we began to see longer-dated bullish flow, especially long-dated call buying, in several Mag7 names. This may represent an attractive and asymmetric setup if the right tail scenario begins to materialize.