Wall Street’s historic weekly winning streak came to an abrupt halt last week. On Friday, a sharp NFP report drove the S&P 500 down over 2.6%, leading to a sharp AI selloff and rising bond yields. Adding fuel to the fire, the market now appears to be pricing in a rate hike by the end of 2026.
We wrote last week about volatility spasm risk, driven by unusual single stock vs. index dispersion. Our Founder’s Notes this week echoed much of that risk, starting with Monday’s pre-market analysis:
“The major call froth has us on red alert for a volatility spasm. In this environment, we just need a trigger to see a sharp correction in stocks. Tread lightly.”
The sharp correction certainly manifested in Friday’s 200 point drop. Looking ahead, the AI unwind and upcoming major events — such as the SpaceX IPO — threaten to keep near-term volatility elevated.
Violent Capitulation in the Semiconductor Sector
The semiconductor sector is now the market’s clearest pressure point. On Friday morning before the selloff, we highlighted SMH’s extreme positioning. Both Skew Rank and IV Rank sat above 90%, indicating elevated demand for upside exposure: traders aggressively bought calls as momentum carried semiconductor stocks higher.
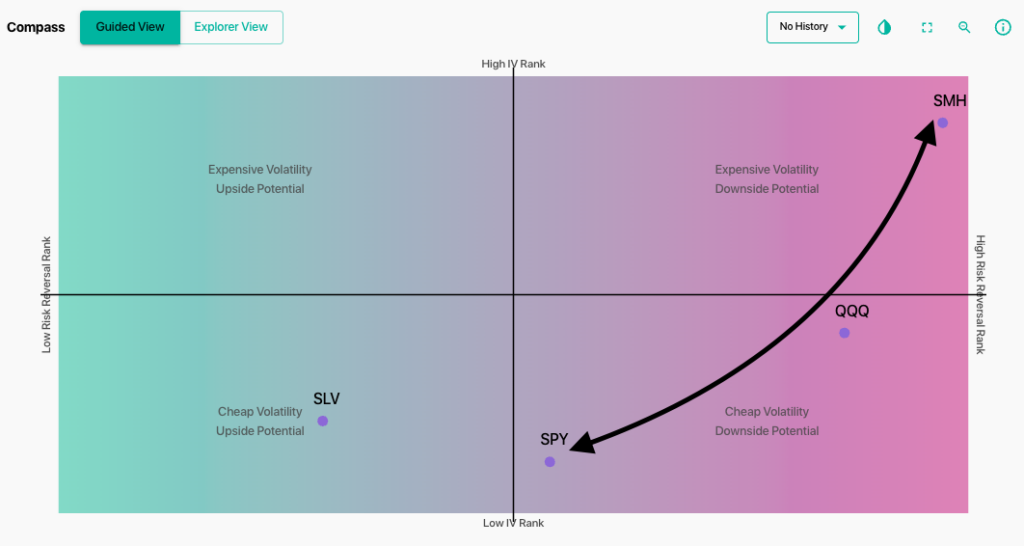
Extreme positioning has a tendency to mean-revert, and that reversal can come quickly. In the case of SMH, the dynamic quickly flipped as traders closed long call positions. SMH declined 9.2% — the ETF’s largest one-day drop since March 2020.
Breaking down SMH’s dealer gamma profile on Friday morning, the ETF opened just below the 610 large positive gamma strike. The selloff led to an expansion in negative gamma, as market makers hedged by selling into the price decline.
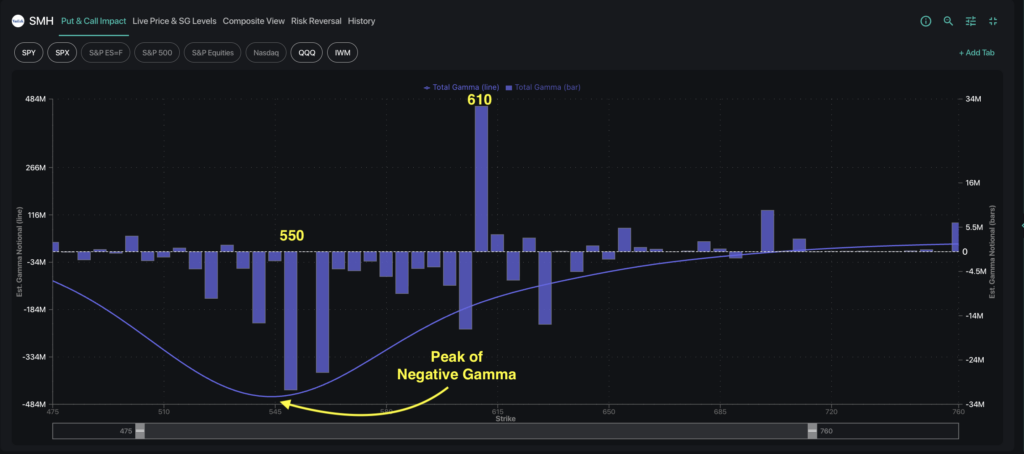
SMH ultimately closed near 570, close to peak negative gamma. This means dealer hedging flows are likely to exacerbate further price movement for the semiconductor ETF.
Given the recent dominance of the AI trade, this risk does not remain confined to semiconductor stocks.
How Did Dealer Hedging Amplify the Selloff?
Semiconductor-related names account for roughly 18% of the S&P 500, meaning a significant unwind in SMH positioning has meaningful implications for the broader index.
Friday’s real-time options flow pointed to fragility across equities. Using our HIRO indicator, we observed -$8 billion of cumulative delta for all stocks within the S&P complex — the largest reading in the last 30 days. HIRO tracks cumulative delta from call and put transactions, used to gauge the direction and magnitude of dealer hedging pressure.
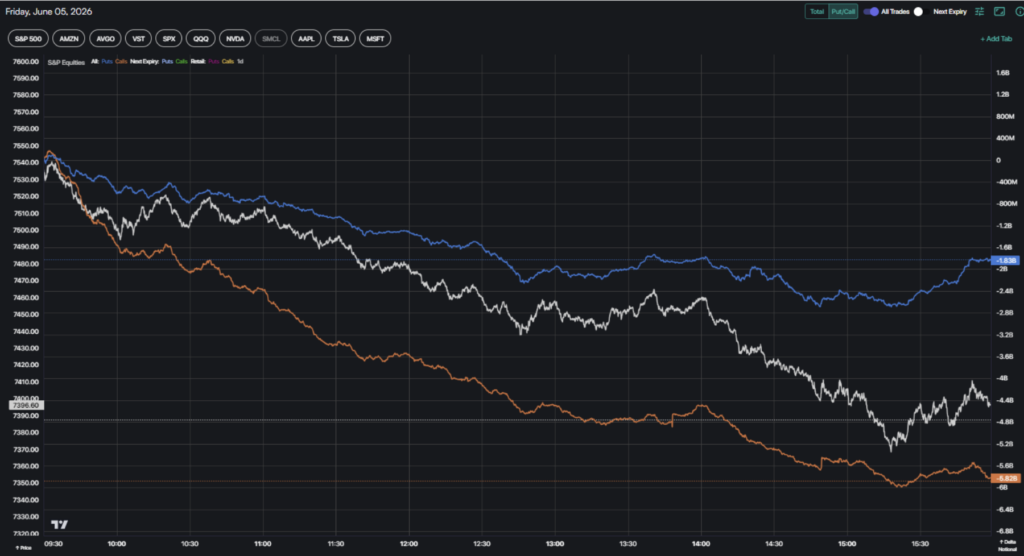
On Friday we observed very heavy call selling activity (orange line) alongside meaningful put buying (blue line). Interestingly, over 65% of all downward hedging pressure was associated with longer-dated options flows.
Catalysts Watch into SpaceX IPO
Friday’s market drop was notable for its breadth, with equities, bonds, bitcoin, and gold all declining together. With multiple asset classes selling off simultaneously, one question is present on many traders’ minds: how does this bode for the upcoming SpaceX IPO?
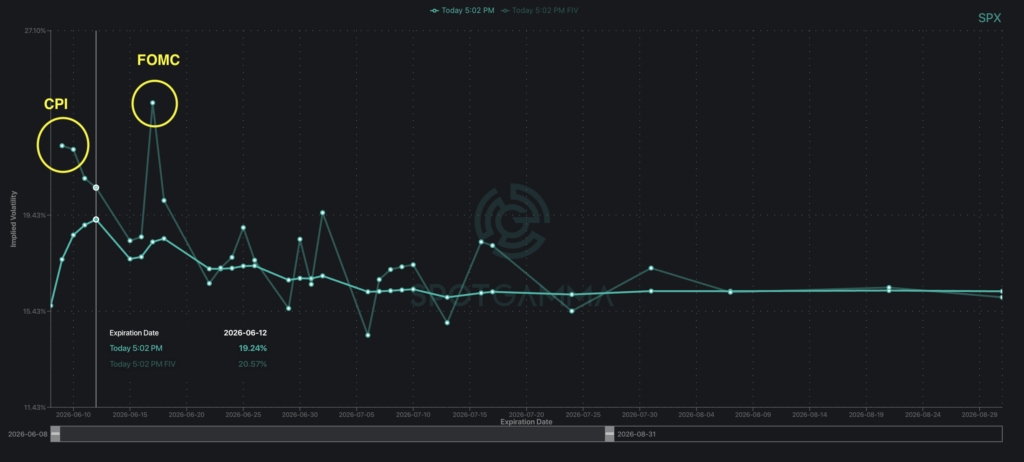
Looking ahead, SPX implied volatility remains elevated at least through the June 12 IPO date. We also note that Forward Implied Volatility remains significantly above the current term structure for the next CPI release (June 10) and FOMC (June 17). This suggests the options market may not be fully reflecting the volatility risk associated with those events.
To trade the upcoming week effectively, there are two overarching key questions to ask:
- What does the volatility setup look like for major indices, and the top stocks?
- How are dealers positioned — are they likely to accelerate any price movement (negative gamma), or trade against it (positive gamma)?
To answer the first question, we look to Compass, alongside our volatility dashboard, to understand the market’s expectations for the direction and magnitude of price movement. For the second question, we will be observing our Synthetic Open Interest model to better understand dealer positioning each day through the week ahead.
Taken together, we see elevated volatility lingering in the near term. Specifically, we are watching whether crowded AI positioning resolves through a controlled cooldown or a sharper flush.
Until the volatility regime normalizes, the setup favors larger market swings. For now, the data argues for caution rather than conviction heading into a catalyst-heavy week.
