The S&P 500 bounced back 2% last week after scraping against 6-month lows. Mixed headlines on the Iran conflict explained much of this tug-of-war, yet markets are still holding their breath.
For many traders, the rally felt counterintuitive: How can equities rally so furiously if geopolitical uncertainties remain unresolved?
When looking at Tuesday’s major bounce in particular, traders cannot ignore the role of the quarterly JPM Collar Trade. This position is a massive quarterly options hedge where an out-of-the-money call is sold while an out-of-the-money put spread is bought. When a position this large expires, the impact can reverberate throughout the market.
As the quarter ended on March 31, our AM Founder’s Note that day flagged just how impactful the JPM Collar’s 6,475 put strike could be:
“We have +$20bn in gamma tied to the JPM strike… If the market rallies, this large 0DTE negative gamma should provide strong rally fuel.”
The JPM Collar ultimately stood at the center of Tuesday’s upswing. While headlines drove price swings from weekly lows, we reiterate that options positioning is adding fuel to this fire.
How the JPM Collar Unlocked the Rally
As we’ve noted previously, negative gamma means outsized moves in either direction become more likely as options dealers are forced to hedge their positions. On Tuesday, March 31, buying pressure from dealers amplified a headline-driven move into something much larger, explaining why the market moved as far and as fast as it did.
Early that afternoon, President Trump announced that he expected a “very quick” end to the Iran conflict. The market response was exuberant as the rally kicked off.
In this case, the message came while dealer gamma remained deeply negative, as shown in the TRACE gamma heatmap below. The culprit for this negative gamma was the massive JPM put contract at 6,475, directly above spot price at that time.
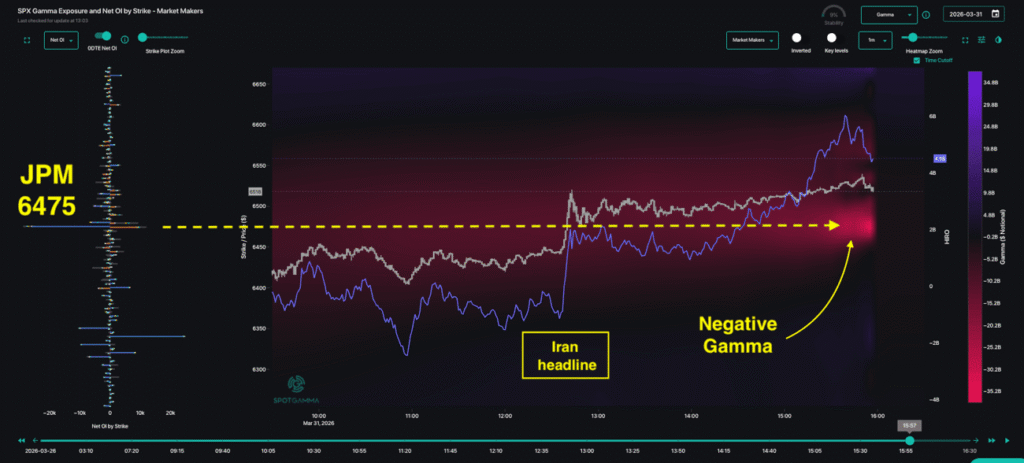
The negative gamma environment meant that dealers had to hedge their positions by buying as price rose, leading to sudden upward momentum. The result? SPX shot up nearly 100 points in just minutes.
In other words, the headline ignited the market a direction, while dealer hedging —coutesy of the massive JPM trade — shaped how far the rally would extend.
Volatility “Resets” Yet Concerns Remain
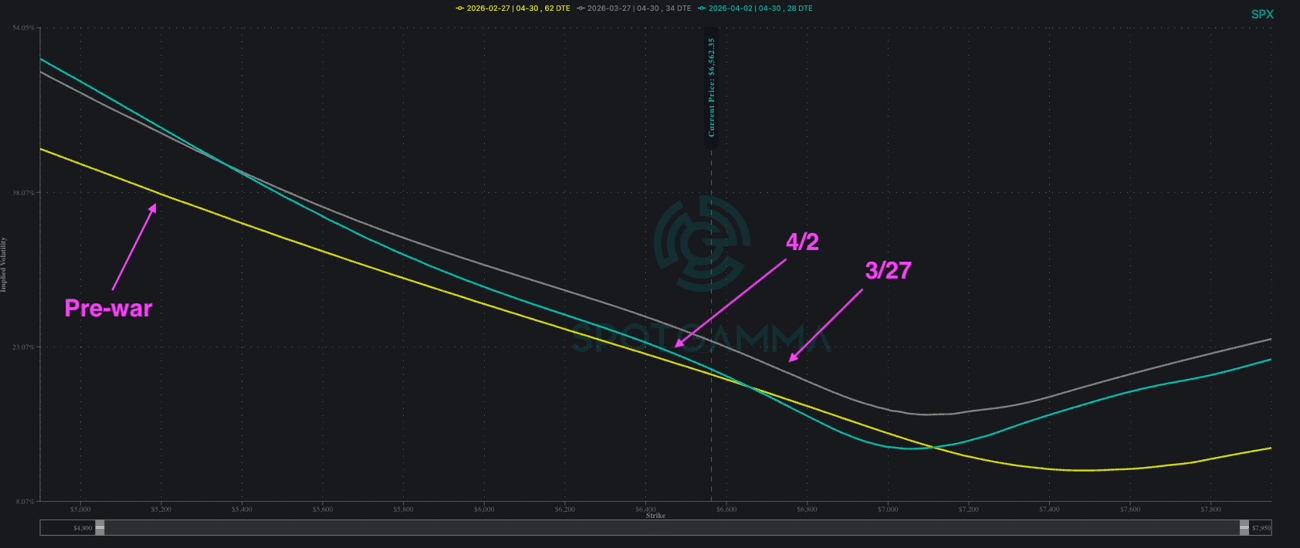
Despite last week’s rally and lower IVs, volatility skew remains notably steep.
SPX implied volatility has declined last week compared with a week ago, yet IV remains elevated relative to pre-conflict levels in late February. Even with some softening in the center, this curve suggests that traders continue to hold tail hedges on both sides.
Perhaps most importantly, the relationship between implied and realized volatility has now flipped. While implied volatility previously traded at a premium to realized volatility as recently as last week, we are now seeing implied volatility fall below realized volatility: SPX ATM IV for the coming Monday is now 15.9%, compared to 1-month realized volatility of 18.2%, with a vol dispersion of ~2.3%.
With several sessions posting ~200 basis point intraday moves, realized volatility is grinding higher. This suggests that options may now be underpricing the magnitude of potential market swings.
PCE, CPI, FOMC: What the Options Market Tells Us
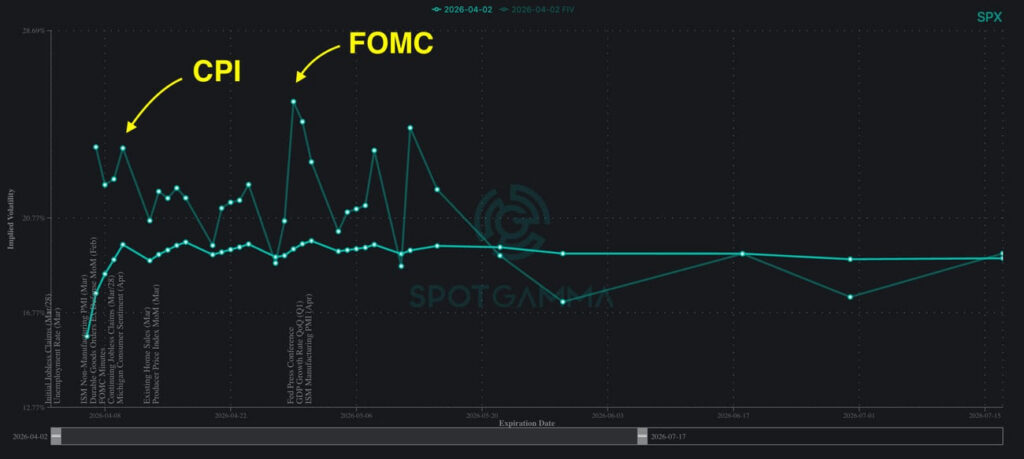
While the Iran conflict has established an ongoing state of caution in the market, several significant data points yet lie ahead: PCE on April 9, CPI on April 10, and FOMC on April 29. The SPX Term Structure has returned to contango — which means options are pricing in higher volatility in the weeks ahead than in the near term.
Comparing that curve with Forward IV shows a meaningful spread around both the CPI and FOMC dates, suggesting current positioning may not fully reflect the event risk those catalysts could bring.
Between negative gamma, the IV-RV flip, and a still-steepened vol curve, the data suggests traders should remain alert. There is no doubt that headline catalysts can continue to whipsaw this market; we encourage our readers to watch the underlying mechanics closely to gauge how any further developments might play out.