### You must be logged in to access this content. Don’t have an account with SpotGamma? Sign up today to view unique key levels, Founder’s Notes, market commentary, options analysis tools, and expert insights. If you’re already a SpotGamma subscriber, log in here: Username or E-mail Password Remember Me Forgot Password
Archives for January 2020
Zero Gamma Holds Again – Virus Edition
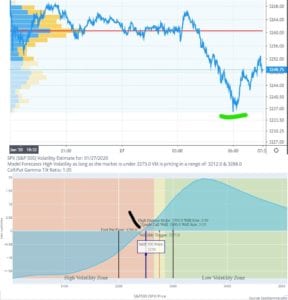
A combination of new regarding the Chinese virus spreading and Iraq being bombed sent futures lower on Monday AM. Oddly the low of the overnight session was 3237, which we calculated to be the zero gamma threshold. Remarkably the same thing occurred a few weeks ago on the eve of the Iranian bombing. Should the […]
Nomuras Combined Gamma May Be Off
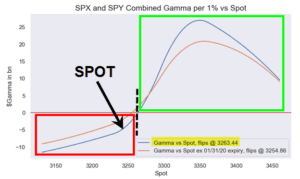
Here are the Nomura gamma charts via ZH. Not their flip point at 3263, id argue this is too high. Nomura combines SPY and SPX and I believe they can have very different profiles. Compare the Nomura gamma chart with our separate SPY and SPX charts. The zero gamma level on our charts is where […]
SpotGamma Gamma Report for: 01/27/2020 AM
### You must be logged in to access this content. Don’t have an account with SpotGamma? Sign up today to view unique key levels, Founder’s Notes, market commentary, options analysis tools, and expert insights. If you’re already a SpotGamma subscriber, log in here:
Hedging Into the Close
@VolCurve brought up a great point today – ” Don’t mistake gamma hedging for strength.” It was an interesting example today of what looks like gamma hedging moving the market into the close. The market was quite weak today, but some force kept bringing us higher towards 3300 into the close. SPX options settle at […]
SpotGamma Gamma Report for: 1/24/20 PM
### You must be logged in to access this content. Don’t have an account with SpotGamma? Sign up today to view unique key levels, Founder’s Notes, market commentary, options analysis tools, and expert insights. If you’re already a SpotGamma subscriber, log in here:
SpotGamma Gamma Report for: 1/24/20 Noon
### You must be logged in to access this content. Don’t have an account with SpotGamma? Sign up today to view unique key levels, Founder’s Notes, market commentary, options analysis tools, and expert insights. If you’re already a SpotGamma subscriber, log in here:
SpotGamma Gamma Report for: 1/24/20 AM
### You must be logged in to access this content. Don’t have an account with SpotGamma? Sign up today to view unique key levels, Founder’s Notes, market commentary, options analysis tools, and expert insights. If you’re already a SpotGamma subscriber, log in here:
SpotGamma Gamma Report for: 1/23/20 PM
### You must be logged in to access this content. Don’t have an account with SpotGamma? Sign up today to view unique key levels, Founder’s Notes, market commentary, options analysis tools, and expert insights. If you’re already a SpotGamma subscriber, log in here:
Explaining OPEX Drift
This is a repost from MacroTourist. Excellent site and co-host of The Market Huddle podcast. This post will be a little more technical, but it’s important, so I urge you to read on. Over the past couple of years there has been an increased interest in dealers’ gamma charts to help explain market movements. […]
