Fed Chair Kevin Warsh is scheduled to deliver his Jackson Hole keynote Friday, August 28 at 10:00 a.m. ET. The setup is unusually important because the market is trying to determine whether Warsh views the recent rise in long-term yields as sufficient monetary tightening, or whether persistent inflation still requires another Fed hike. (Source: Federal Reserve)
The equity market is acting much more calmly than the bond and gold markets. SPX is around 7,700, only 1.5% below its August 13 record close of 7,798.99, despite 10-year yields around 4.66%, 30-year yields above 5.18%, PCE inflation at 3.7%, and roughly 40% odds of a September rate hike. That resilience tells us equities are still assuming Warsh will not deliberately tighten financial conditions much further.
But the asymmetry matters: the market has already tolerated a lot of bad rate news without selling off much. That makes a benign Warsh speech capable of generating a relief rally, while a genuinely hawkish surprise could produce a much larger repricing than today’s VIX implies.
The Volatility Term Structure Says Jackson Hole Is Not the Main Event
While markets yawn at the prospect of Warsh throwing a curveball at Jackson Hole, the SPY volatility term structure shown below shows that the following week’s Non Farm Payrolls report on Sept 4th actually carries higher forward implied volatility compared to Jackson Hole (faded line below). Additionally, the upcoming mid September FOMC rate decision on Sept 16th shows a higher forward IV peak, with October IV’s also trending up with midterm elections in focus. The options market seems to suggest Jackson Hole may end up being a nothing burger while the real potential for market moves could be lurking in the following weeks as September unfolds.
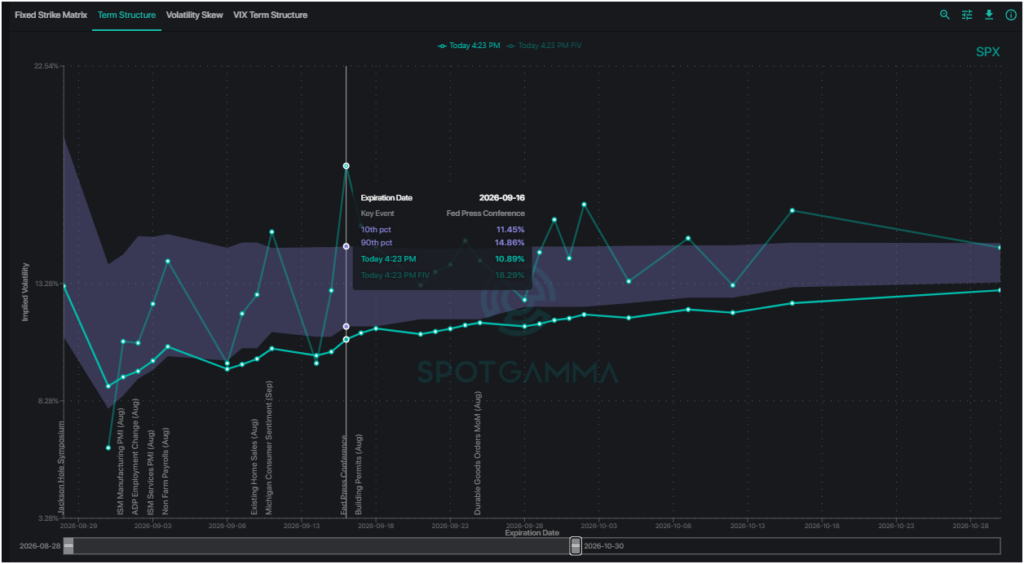
SpotGamma SPX Term Structure chart showing current IV (teal line) and forward IV (faded line).
The above chart is a fairly constructive signal for equities, with one important caveat: the options market is pricing low overall stress and only modest near-term event risk, which means a genuine hawkish surprise can hurt more than the current volatility surface suggests. The most important feature is the shape of the volatility curve: it is generally upward sloping from roughly 11–12% in the very short end toward 13%+ by November.
That is normal contango, not crisis-style backwardation. When markets become genuinely worried, front-end volatility tends to explode above longer-dated volatility as investors urgently pay for immediate protection. That is not happening here.
So the options market is effectively saying:
“There are known events ahead, but we do not expect a major equity dislocation.”
This sentiment ultimately supports stocks. Coupled with a potentially positive reaction for AI stocks following Nvidia’s solid guidance, this bodes well for the continued theme of volatility dispersion across the stock market.
If Warsh says nothing materially more hawkish than expected, we could see SPX higher, VIX lower, and short-dated SPY IV collapsing. That combination frequently creates the familiar post-event “relief rally.”
Low Implied Volatility Does Not Mean the Event Is Safe
But this is where the setup becomes interesting. Low implied volatility doesn’t necessarily mean the event is safe. It means the market thinks the event is safe. Those are different things.
Because relatively little event premium is embedded in SPY options, Friday has an interesting asymmetry:
Benign Warsh outcome
Stocks may rise perhaps moderately, but implied volatility likely gets crushed quickly. The market already expects something close to this outcome.
Significant hawkish surprise
The options market would have to rapidly reprice both: expected equity movement and the probability of continued volatility afterward. That can turn a relatively ordinary 14% IV environment into 18–20%+ very quickly. This is why the chart actually argues that tail risk is somewhat underpriced.
For equity traders, the 10-year and 30-year bond market’s reaction may tell you more than the Fed headlines themselves. The important issue is that long rates aren’t rising exclusively because investors expect Fed hikes. Treasury supply, deficits, term premium and competition for capital from enormous AI infrastructure investment are also playing a role. Reuters notes that this distinction is exactly what investors want Warsh to clarify.
How Are Bond Markets Positioned?
Another wild card in the bond market is the fact that CTA positioning is now heavily short in Treasury futures. This is one of the most important under-the-surface positioning dynamics going into Jackson Hole. This creates the potential for a nonlinear move lower in yields if bonds begin to rally. Bank of America said last week that CTA positioning in U.S. Treasury futures remained “heavily/stretched short.” Goldman Sachs’ futures desk separately estimated CTA/trend-following bond exposure near multi-year bearish extremes, around -$155 million DV01 globally, and estimated that a sufficiently strong bond rally could generate roughly $150 million DV01 of covering/rebuying over a month. (Source: Investing.com)
CTAs are systematic trend-following funds. They generally aren’t sitting around deciding whether Kevin Warsh sounds hawkish or dovish.
Their models see something like:
Bond prices ↓ → trend deteriorates → short Treasury futures → yields ↑ further → trend becomes stronger.
So when CTAs remain heavily short ZN, ZB, etc., they become effectively positioned for Treasury prices to continue falling and yields to continue rising. The important characteristic is that they eventually reverse mechanically. If bond prices rally enough to cross their trend/momentum thresholds, that is a potential squeeze.
While CTA’s position themselves in the bond futures, it’s useful to monitor options markets in TLT which is the ETF that tracks long term treasuries. We can see the put and call impact from the gamma chart below and that there is a concentration of large call gamma at the $85 strike with the gamma flip point currently just below that mark. Essentially, if TLT were to see a clear breakout above the $85 level that may propel prices much higher in a squeeze-like fashion.
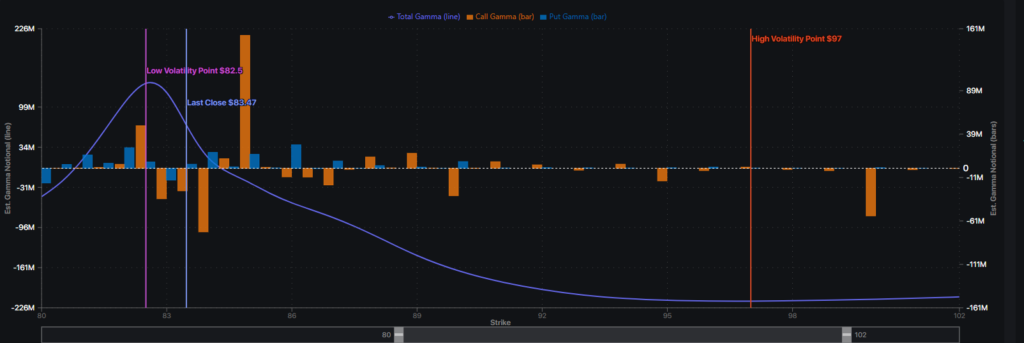
SpotGamma Synthetic Open Interest gamma model for TLT, showing call net gamma (orange) and net put gamma (blue)
Goldman’s estimate was around $150 million DV01 of potential covering under a roughly two-standard-deviation bond rally scenario. That’s extremely important. If yields begin to fall quickly, CTAs have to buy Treasury bonds. That buying pushes yields even lower. Lower yields generate further CTA buying. You get a feedback loop. So the current Treasury positioning potentially has positive convexity to a bond rally.
What about Gold?
Gold has been extremely strong recently, reaching a three-month high. The yellow metal often leads volatility in other asset classes and has started behaving like a traditional macro barometer again. (Source: Reuters)
A dovish Warsh at Jackson Hole with falling yields and a falling dollar should continue the gold rally, but there is an interesting longer-term wrinkle. Gold’s extraordinary underlying strength despite high nominal and real yields suggests there is also demand driven by fiscal credibility, geopolitical risk and concern over the purchasing power of fiat currencies.
So a hawkish Fed could hurt gold initially while simultaneously reinforcing the longer-term reason some investors own it.
A Treasury short squeeze is normally a favorable cocktail for gold so watching the reaction from interest rates Friday as well as the USD will tell us a lot about the path for gold.
Looking at the SpotGamma Synthetic OI Model, the key strike for GLD sits at 430 where dealers are short calls from customer longs. Gamma is decidedly negative in GLD options and that can fuel a rally further into 430. Overall gamma is negative all the way up to its current flip point at 440. On the downside 415 sticks out as a positive gamma support potentially on a dip.
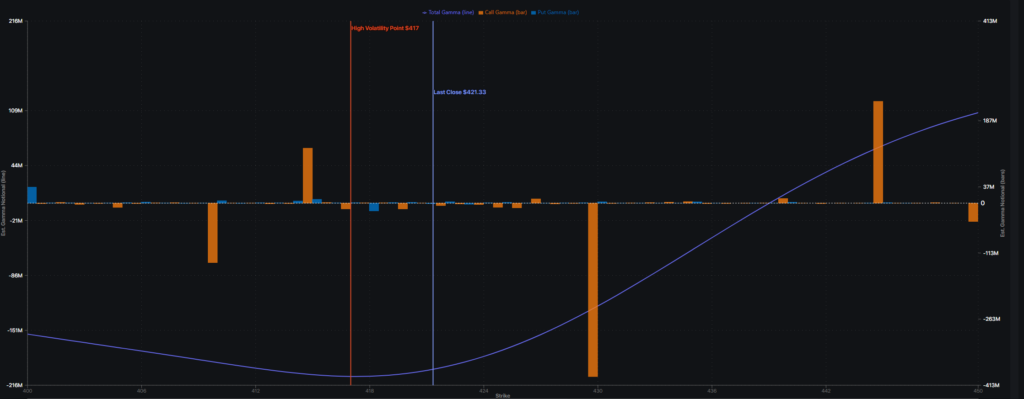
SpotGamma Synthetic Open Interest gamma model for GLD, showing net call gamma (orange) and net put gamma (blue)
Bottom Line for Jackson Hole and Markets
Now if we connect all this positioning back to Friday and Jackson Hole, the heavy CTA Treasury short makes the current setup more asymmetric than the SPX volatility market suggests. Underneath that calm SPX surface sits a bond market where trend-following positioning is already stretched bearish. A dovish/less-hawkish Warsh surprise potentially has more upside convexity for stocks than people realize because it could trigger a Treasury short squeeze. Does the initial bond rally become large enough to force systematic traders to chase it?
If the answer is yes, the Treasury market could become the fuel behind an SPX/QQQ breakout rather than merely a reflection of the Fed speech. And the following weeks lead into a 3 day holiday weekend (Labor Day) which tends to allow VIX to grind lower.
The below chart shows SPX with its gamma flip area near 7780 so negative gamma above that level would ignite a stronger potential squeeze to new highs, possibly led by the move in treasuries and rates.
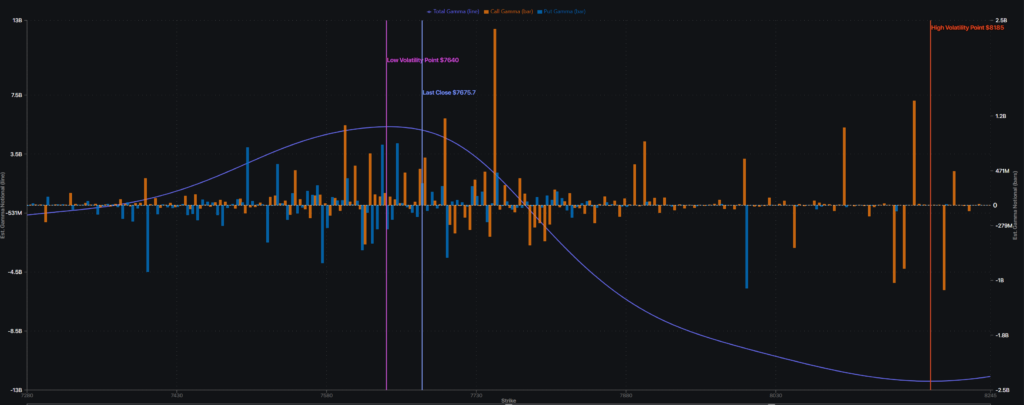
SpotGamma Synthetic Open Interest gamma model for SPX, showing call net gamma (orange) and net put gamma (blue)
Keep in mind the September triple witching OPEX is a large expiration and now just three weeks out. Historically, the path September takes at the start has tended to continue that trend move into Sept OPEX week, and it’s intriguing to note that SPX 8,000 is a convenient round number that markets may want to explore into the end of summer. As we mentioned, tail risk is underpriced meaning relatively inexpensive calls could protect or profit from a move up to 8,000.