June lived up to its reputation as a volatile month with last week’s market drawdown. As we turn the page into July, the market now appears to be recalibrating positioning. Recent turbulence has driven capital rotation out of crowded tech leadership, and we now look for opportunities in alternative pockets of the market.
In our Founder’s Note ahead of OPEX, we warned that significant positive gamma support was set to roll off, which could have a destabilizing effect:
“Our base case into OPEX is a 1-2% correction (ref 7,475)…We are left with SPX vols that are ultimately higher after VIX expiration yesterday morning, but also a less stable gamma regime going forward.”
On Monday, we further highlighted stretched bullish positioning as the COR1M dipped to recent lows. This combination left the market vulnerable, pulling the S&P 500 roughly 3% lower over the course of the week.
Following the OPEX and dispersion-led correction, we see that traders are adjusting their positions accordingly. Looking at the Volatility Dashboard’s Volatility Skew chart, July’s expiration curve has steepened compared to the prior week as out-of-the-money strikes remain expensive.
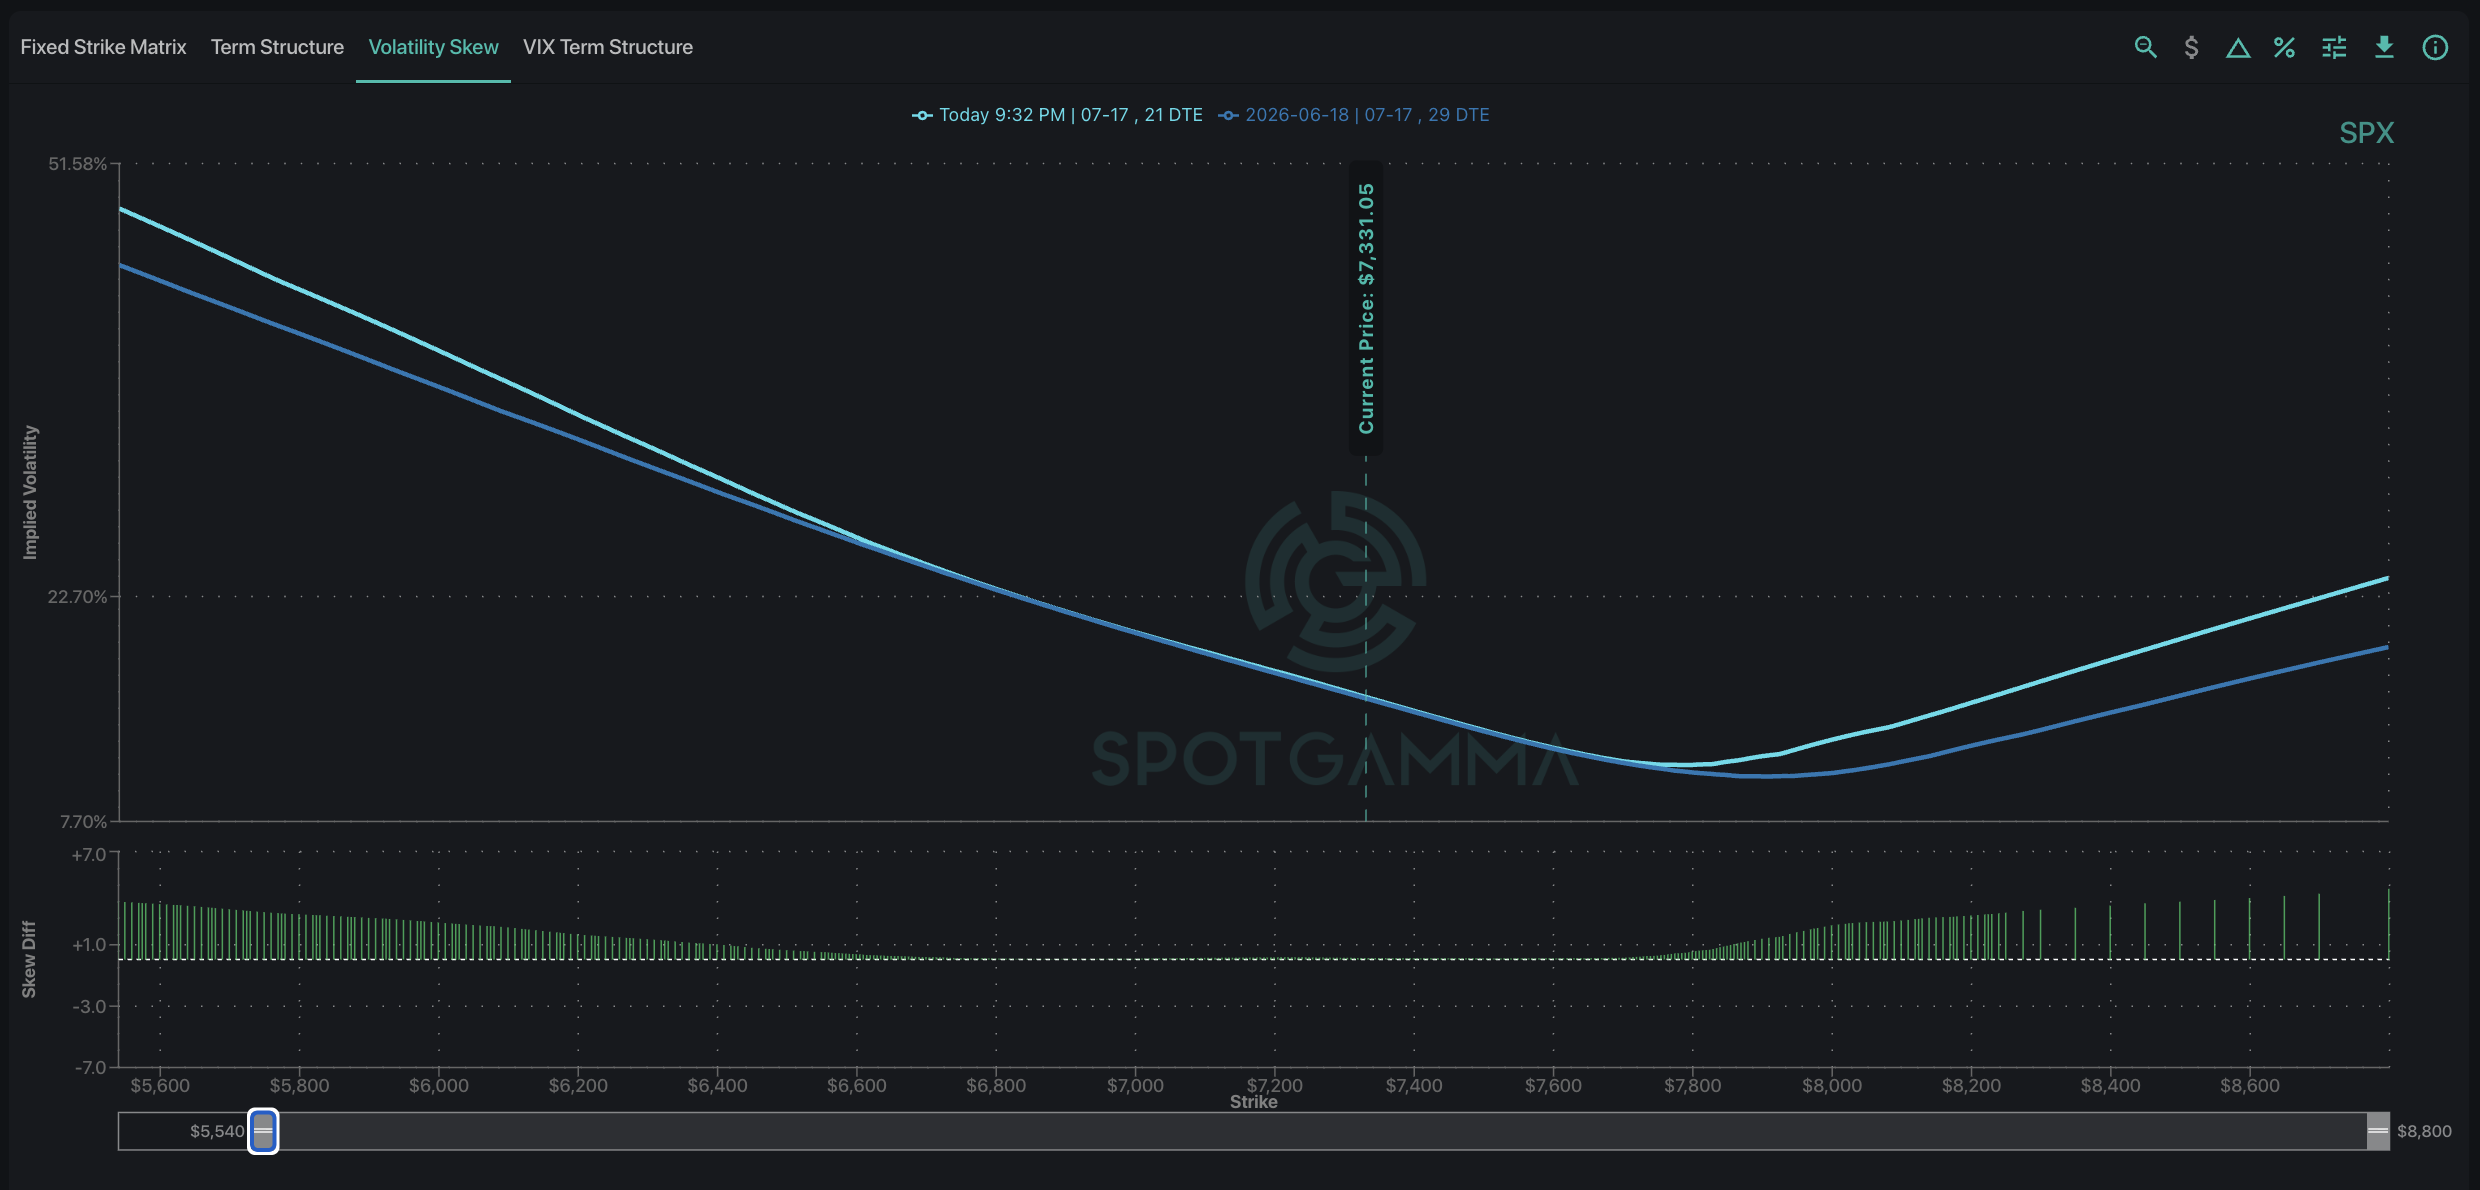
This suggests that traders began deploying strategies to capitalize on convexity from both sides of the market. Beneath the surface, market participants are now positioned for wider trading ranges, while keeping their overall directional exposure relatively balanced.
Following the Money: A Healthcare Rotation
Beneath index-level weakness, another question emerges: where is the money now going? As Mag 7 and AI-driven names cool, capital has rotated into other sectors, with healthcare standing out as one of the primary beneficiaries.
We screened the sector for names trading near key SpotGamma key levels while also evaluating tactical opportunities using Compass. The Compass grid uses options pricing to show the market’s directional and volatility expectations for individual names.
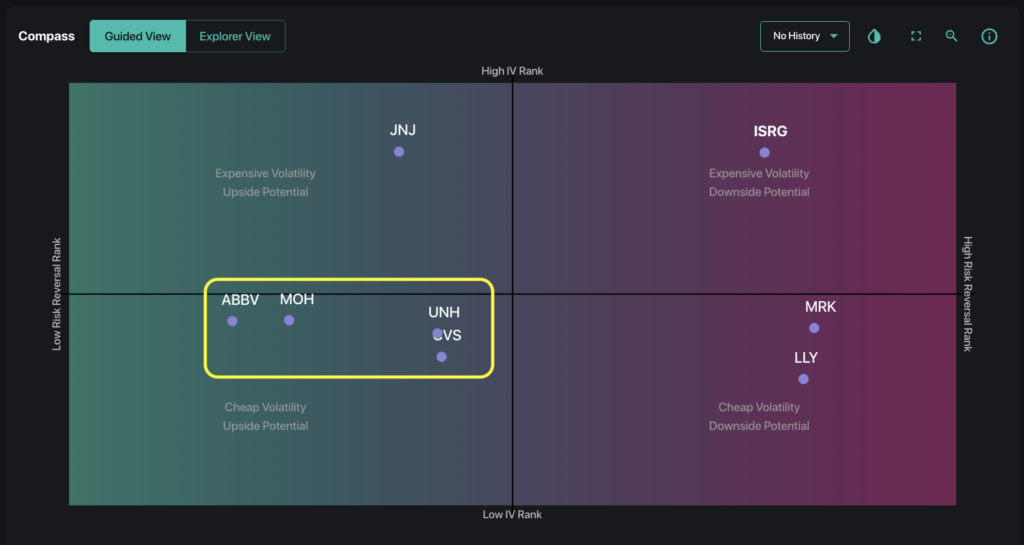
As shown above, the major names in the healthcare space appear relatively scattered. The largest cluster appears in the lower left corner: UNH, ABBV, CVS, and MOH showed relatively cheap options pricing and upside potential. Pharmaceutical giant JNJ displayed elevated IV Rank but with heavier put-buying, suggesting a more defensive profile.
Several other names display more bullish stances: ISRG stood out with elevated pricing with calls heavily bid bid, signaling strong demand for upside exposure. MRK and LLY showed moderate options pricing with a similar tilt toward bullish skew.
In addition to options positioning and key level proximity, we suggest anyone trading these names carefully watch real-time options flow. Analyzing the options market from multiple dimensions can reinforce a trade thesis and help identify high-conviction opportunities
July’s Catalyst Cluster: What to Watch
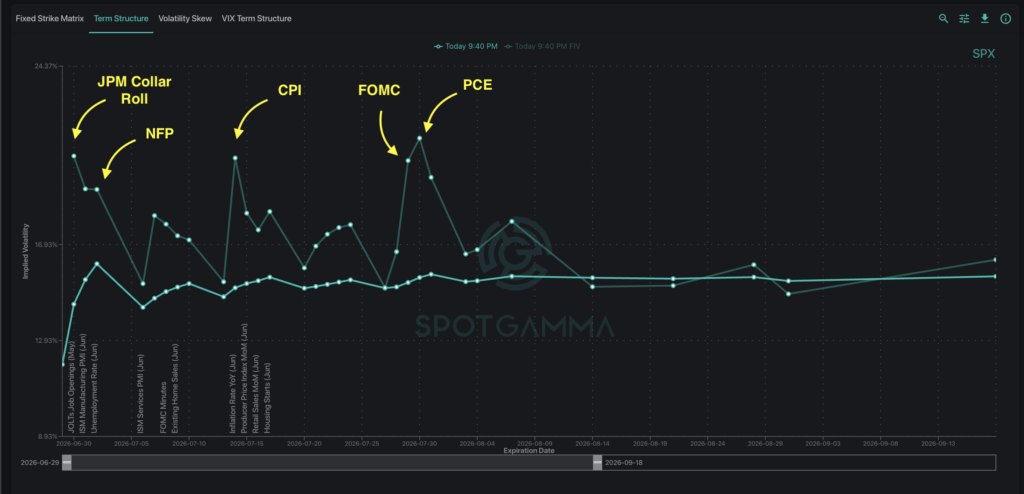
If June reset positioning, then July will likely determine where the next opportunities emerge. The upcoming week begins with the JPM collar roll on Tuesday (June 30), followed by Nonfarm Payrolls on Thursday (July 2) and the observed Independence Day market holiday (July 3).
As shown in the Volatility Dashboard’s Term Structure, forward-implied volatility remains elevated for next week relative to surrounding maturities. This implies that the options market continues to price in elevated event risk.
Further out, the catalyst watch continues with several notable July dates on the horizon:
- July 14: CPI
- July 17: Monthly OPEX
- July 29: FOMC
- July 30: PCE
There is also a structural backdrop worth highlighting. Since the Fed moved away from providing explicit forward guidance, markets have had less visibility into future policy expectations. That uncertainty can increase the importance of each major macro release, lifting implied volatility heading into these events.
