When volatility, positioning, and directional signals align, swing trades can deliver strong returns with defined risk. Coinbase (COIN) provided a clean example of this, as multiple SpotGamma indicators pointed to a bullish setup with expanding range potential. Shifts higher in key Gamma levels, combined with rising demand for calls, signaled that traders were positioning for […]
Doug Pless
NVIDIA Rejection at Call Wall Triggers Intraday Selloff as SpotGamma Delivers High-Conviction Short Setup
When large amounts of Gamma are set to expire and price approaches key resistance, volatility and directional moves can accelerate quickly. NVIDIA (NVDA) provided a textbook example of this dynamic, as a rally into a major call wall led to a sharp reversal driven by options positioning. With heavy Call Gamma dominating the structure and […]
Meta Rips to $530 Then Reverses; SpotGamma Flow Signals Identify Both Sides of the Trade
When Gamma levels shift higher and options flow aligns, markets can deliver powerful directional moves — and equally sharp reversals. Meta (META) offered a clean example of both in a single session, as bullish positioning drove a rally into liquidity before flow exhaustion marked the high of the day. SpotGamma tools highlighted a strong bullish […]
How SpotGamma Identified NVDA’s 900 Reversal — And Mapped the Entire Move Lower
This NVDA case study shows how a single level — the 900 Call Wall — set the stage for a high-probability intraday reversal, with SpotGamma tools mapping the move from resistance all the way down to key support levels. By combining positional analysis with real-time flow signals from HIRO, traders could anticipate both the breakdown […]
Trade Analysis: ES Futures (September 19, 2022, Post-Expiration Monday)
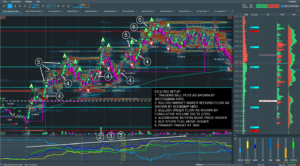
The following is a guest post from Doug Pless. Preparation When I plan to trade futures, I begin my morning preparation by reading the SpotGamma AM Founder’s Note. For ES futures, I note key Gamma levels for SPX and SPY, the SpotGamma Imp. 1 Day Move for SPX, the SpotGamma Gamma Index and Gamma Notional […]
Trade Analysis: QQQ (August 15, 2022)
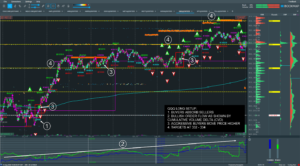
The following is a guest post from Doug Pless. At SpotGamma, our community uses the SpotGamma AM Founder’s Note when preparing to trade index products such as the QQQ (Nasdaq 100 ETF). Specific levels to note include the following: Volatility Trigger, SpotGamma Absolute Gamma Strike, Put Wall, and Call Wall. Additional levels are the CP […]
Trade Analysis: NVDA (July 20, 2022)
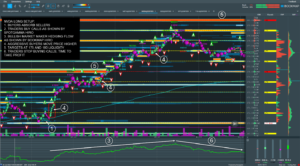
The following is a guest post from Doug Pless. When I plan to trade stocks for the day, I begin my morning preparation by opening my watchlist in Equity Hub. I look at the Key Gamma Strike, Hedge Wall, Key Delta Strike, and other metrics for each stock and compare the values with the previous […]
Trade Analysis: TSLA (June 17, 2022)
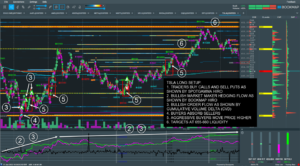
The following is a guest post from Doug Pless. When I plan to trade stocks for the day, I begin my morning preparation by opening my watchlist in Equity Hub. I look at the Key Gamma Strike, Hedge Wall, Key Delta Strike, and other metrics for each stock and compare the values with the previous […]
Trade Analysis: AMD (May 26, 2022)
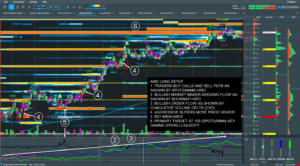
The following is a guest post from Doug Pless. When I plan to trade stocks for the day, I begin my morning preparation by opening my watchlist in Equity Hub. I look at the Key Gamma Strike, Hedge Wall, and other metrics and compare the values with the previous values for the last five days. […]
Trading Stock Using Equity Hub and HIRO
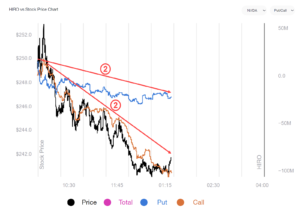
The following is a guest post from Doug Pless. When I plan to trade stocks for the day, I begin my morning preparation by opening my watchlist in Equity Hub. I look at the Key Gamma Strike, Hedge Wall, and other metrics and compare the values with the previous values for the last five days. […]