• Skip to main content
  • Skip to primary sidebar

SpotGamma™

S&P 500 Stock Market Gamma Trading Levels Based on Options Open Interest

  • About
  • Pricing
  • Academy
    • FREE TRADE PLANNING WEBINAR
  • Resources
    • Tool Demos
    • Case Studies
    • Blog
    • Support Center
    • Daily Report
    • Free Trading Tools
      • Opening Setup Free Report
      • Options Profit Calculator
      • SPX Gamma Exposure
      • Implied Earnings Moves
    • Report Card
  • Login

implied volatility

Jul 14 2021

Implied Volatility Reading in the SPX & VIX

Brent Kochuba, Founder of SpotGamma, joins Imran Lakha of Options-Insights to talk about the current volatility readings in the SPX and VIX. This covers both realized and implied volatility which are shifting ahead of a large options expiration.

Written by developer · Categorized: Market Analysis · Tagged: implied volatility, realized volatility, VIX

Feb 15 2021

TLRY & Pot Stock Gamma

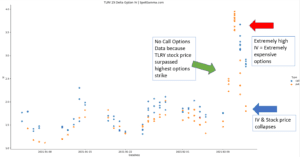
Scatter plot of TLRY 25-delta option IV in Jan-Feb 2021 showing calls, puts and high IV annotations.

When a stock trades higher at a very rapid pace the price of the stock can pass the highest available options strike. For instance, at the start of the day on 2/9/21 the available call options strikes for Tilray (TLRY) ranged from ~5-$50. However the stock ripped over 50%, passing the 50 strike. When a […]

Written by SpotGamma · Categorized: Market Analysis, Stock · Tagged: gamma squeeze, implied volatility, TLRY

Jan 11 2021

TSLA Options For Sale

tsla options for sale

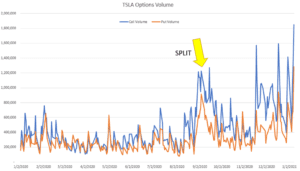
The week ending 1/8/21 saw a record high in TSLA options volume, with the stock surging nearly 20%. Traders have been flooding into weekly options as the way to express their views on the stock which was just recently added to the S&P500 Index. We view increased buying of call options as a driver for […]

Written by SpotGamma · Categorized: Market Analysis, Stock · Tagged: implied volatility, TSLA

Jan 07 2021

SPX Options Vanna Rally

Recently we have been discussing with subscribers the elevated implied volatility in the S&P500 due to the 1/5 election events. The VIX is a decent measure of implied volatility in the S&P, and you can see that despite the market being at all time highs, the VIX was well off lows. Our feeling was that […]

Written by SpotGamma · Categorized: Market Analysis · Tagged: implied volatility, Options Vanna

  • « Go to Previous Page
  • Go to page 1
  • Interim pages omitted …
  • Go to page 6
  • Go to page 7
  • Go to page 8

Primary Sidebar

SpotGamma-Subscriber-Signup-Banner

  • The Market’s Rebound Fuel Runs Low
  • The OPEX Effect: A Put-Heavy Expiration And The Thanksgiving Window
  • Applied Materials Earnings Preview: Can AI Demand Deliver a Move Beyond the 7% Options Hurdle?
  • Options Action: Nvidia Vol Looks Rich While Apple’s Stays Muted
  • CoreWeave Earnings Preview: Can AI Demand Outrun the Cost of Growth?
  • youtube
  • x
  • Privacy Policy
  • Disclaimer
  • Terms & Conditions
  • Support Center
  • Media
  • Contact Us

©2026 TenTen Capital LLC DBA SpotGamma

All SpotGamma materials, information, and presentations are for educational purposes only and should not be considered specific investment advice nor recommendations. Futures, foreign currency and options trading contains substantial risk and is not for every investor. An investor could potentially lose all or more than the initial investment. Risk capital is money that can be lost without jeopardizing one's financial security or lifestyle. Only risk capital should be used for trading and only those with sufficient risk capital should consider trading. Past performance is not necessarily indicative of future results. Testimonials appearing on this website may not be representative of other clients or customers and is not a guarantee of future performance or success.

View Full Risk Disclosure