
• Skip to main content
  • Skip to primary sidebar

SpotGamma™

S&P 500 Stock Market Gamma Trading Levels Based on Options Open Interest

  • About
  • Pricing
  • Academy
  • Resources
    • Tool Demos
    • Case Studies
    • Blog
    • Support Center
    • Free Daily Report
    • Free Trading Tools
      • Options Profit Calculator
      • SPX Gamma Exposure
      • Implied Earnings Moves
      • Volatility Ranking
    • Free Training
    • Report Card
  • Login

S&P 500

Aug 26 2026

One Stock, 803 ETFs: Why Nvidia Earnings Impacts the Entire S&P 500

NVIDIA stock chart showing intraday price of 213.62 with YTD gain of 14.54% and volatility indicator for Q2 earnings.

Brent Kochuba joined CNBC to discuss Nvidia’s earnings, Salesforce, and how options traders repositioned across bond ETFs after comments from Treasury Secretary Bessent.

Written by SpotGamma · Categorized: Market Analysis · Tagged: earnings, Implied Move, NVDA, S&P 500, salesforce, TLT

Dec 10 2024

TRACE Unveils When To Short The S&P 500

Doug-Pless-SpotGamma-Case-Study-TRACE-Short-SP500-December-2024

Want to catch SPX Reversals in Real Time? Pro trader and SpotGamma content contributor Doug Pless executed a precision short trade on December 10, 2024, leveraging SPX/ES Gamma dynamics and real-time flow data. This case study walks through how multiple SpotGamma tools, including TRACE Heatmaps, HIRO, and Equity Hub were used to build a bearish […]

Written by SpotGamma · Categorized: Case Study · Tagged: Case Study, Doug Pless, ES futures, S&P 500

Jun 21 2022

The Oversold Stock Market Could See a Bounce
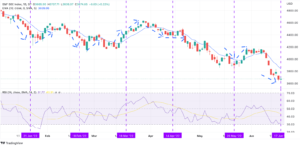
FOMC minutes meeting rally risk

The following is a guest post courtesy of Michael Kramer of Mott Capital Management.  The S&P 500 has fallen by more than 10% in the past two weeks, and to say that it is due for a bounce may be an understatement. The combination of a 75 bps Fed rate hike and massive June quarterly options expiration resulted […]

Written by SpotGamma · Categorized: Guest Post, Market Analysis · Tagged: Bounce, delta tilt, FOMC, Michael Kramer, Rally, S&P 500

Dec 07 2021

The S&P 500 May Drop An Additional 10%
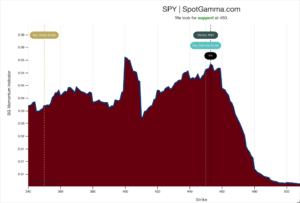
SPY SpotGamma Dec 21

The following is a guest post courtesy of Michael Kramer of Mott Capital Management.  On November 12, I warned that dreams of a seasonal run higher were in doubt and that an end-of-year melt-up could quickly turn into a meltdown. It seems that instead of stocks cruising into the end of the year, they have […]

Written by SpotGamma · Categorized: Guest Post, Market Analysis · Tagged: Equity Hub, Michael Kramer, S&P 500, SPY gamma

Primary Sidebar

SpotGamma-Subscriber-Signup-Banner

  • S&P 500 Negative Gamma Below 7,600 — Brent Kochuba on tastylive
  • CPI Is the Catalyst. 7600 Is the Trade.
  • Trade Idea Generation Using Opening Setup
  • Gamma Guy with tastylive: Options Positioning Pins the Index While Tech Names Make Moves
  • Oracle Earnings Preview: $638B AI Backlog vs. an 11.5% Options Implied Move
  • youtube
  • x
  • Privacy Policy
  • Disclaimer
  • Terms & Conditions
  • Support Center
  • Media
  • Contact Us

©2026 TenTen Capital LLC DBA SpotGamma

All SpotGamma materials, information, and presentations are for educational purposes only and should not be considered specific investment advice nor recommendations. Futures, foreign currency and options trading contains substantial risk and is not for every investor. An investor could potentially lose all or more than the initial investment. Risk capital is money that can be lost without jeopardizing one's financial security or lifestyle. Only risk capital should be used for trading and only those with sufficient risk capital should consider trading. Past performance is not necessarily indicative of future results. Testimonials appearing on this website may not be representative of other clients or customers and is not a guarantee of future performance or success.

View Full Risk Disclosure