• Skip to main content
  • Skip to primary sidebar

SpotGamma™

S&P 500 Stock Market Gamma Trading Levels Based on Options Open Interest

  • About
  • Pricing
  • Academy
  • Resources
    • Tool Demos
    • Case Studies
    • Blog
    • Support Center
    • Free Daily Report
    • Free Trading Tools
      • Options Profit Calculator
      • SPX Gamma Exposure
      • Implied Earnings Moves
      • Volatility Ranking
    • Free Training
    • Report Card
  • Login

zero gamma

Jan 27 2020

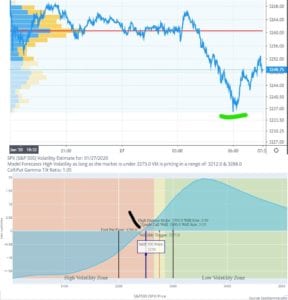
Zero Gamma Holds Again – Virus Edition

A combination of new regarding the Chinese virus spreading and Iraq being bombed sent futures lower on Monday AM. Oddly the low of the overnight session was 3237, which we calculated to be the zero gamma threshold. Remarkably the same thing occurred a few weeks ago on the eve of the Iranian bombing. Should the […]

Written by SpotGamma · Categorized: Market Analysis · Tagged: futures selloff, gamma trap, zero gamma

Dec 05 2019

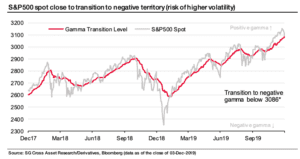
SocGen Zero Gamma Chart History

Here is a backtest of where SocGen calculates where positive gamma changes to negative gamma in the S&P500 (SPY). You can view our historical chart here. The concern is that a move through the zero gamma level may set a “gamma trap“. Our FAQ has more information: Zero Gamma Level: This is the estimated level […]

Written by SpotGamma · Categorized: Market Analysis · Tagged: chart, gamma trap, history, socgen, zero gamma

Oct 31 2019

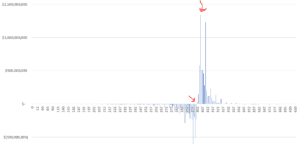
SPY Gamma Visualization

Below is a chart of gamma across all strikes in SPY. You can see that there is a large amount of gamma supply at 305 (right most arrow) and gamma flips from positive to negative around 301. It is below that strike where our model predicts increased volatility as dealers go from buyers to sellers. […]

Written by SpotGamma · Categorized: Market Analysis · Tagged: long gamma, SPY gamma, zero gamma

Aug 09 2019

Volatility Trigger INDICATOR KEEPING LID ON MARKET 8/9/19
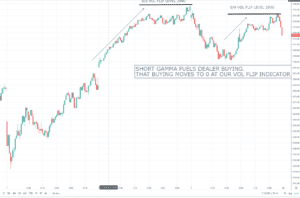
SpotGamma calculates the market level at which options dealers gamma position flips from long to short. We call this the “VOLATILITY TRIGGER” indicator. Below this S&P500 price dealers trading can increase market volatility, and over this level their trading may damped volatility. You can see over the last two days the markets drove hard into […]

Written by tenten · Categorized: Market Analysis · Tagged: dealer buying, gamma flip, volatility trigger, zero gamma

  • « Go to Previous Page
  • Go to page 1
  • Go to page 2

Primary Sidebar

SpotGamma-Subscriber-Signup-Banner

  • Doves Fly into August Jobs Report
  • AI Stock Options Reset From a Record Peak: Brent Kochuba on tastylive
  • How Options Positioning Could Limit a Major Selloff
  • Broadcom is the Next AI Focused Catalyst
  • Software Earnings Reignite Risk Appetite
  • youtube
  • x
  • Privacy Policy
  • Disclaimer
  • Terms & Conditions
  • Support Center
  • Media
  • Contact Us

©2026 TenTen Capital LLC DBA SpotGamma

All SpotGamma materials, information, and presentations are for educational purposes only and should not be considered specific investment advice nor recommendations. Futures, foreign currency and options trading contains substantial risk and is not for every investor. An investor could potentially lose all or more than the initial investment. Risk capital is money that can be lost without jeopardizing one's financial security or lifestyle. Only risk capital should be used for trading and only those with sufficient risk capital should consider trading. Past performance is not necessarily indicative of future results. Testimonials appearing on this website may not be representative of other clients or customers and is not a guarantee of future performance or success.

View Full Risk Disclosure