• Skip to main content
  • Skip to primary sidebar

SpotGamma™

S&P 500 Stock Market Gamma Trading Levels Based on Options Open Interest

  • About
  • Pricing
  • Academy
  • Resources
    • Tool Demos
    • Case Studies
    • Blog
    • Support Center
    • Free Daily Report
    • Free Trading Tools
      • Options Profit Calculator
      • SPX Gamma Exposure
      • Implied Earnings Moves
      • Volatility Ranking
    • Free Training
    • Report Card
  • Login

Apr 20 2022

The Fed Meeting May Spark The Next Stock Market Rally

The following is a guest post courtesy of Michael Kramer of Mott Capital Management. 


Buy the Fed meeting. Sell the Fed minutes. 

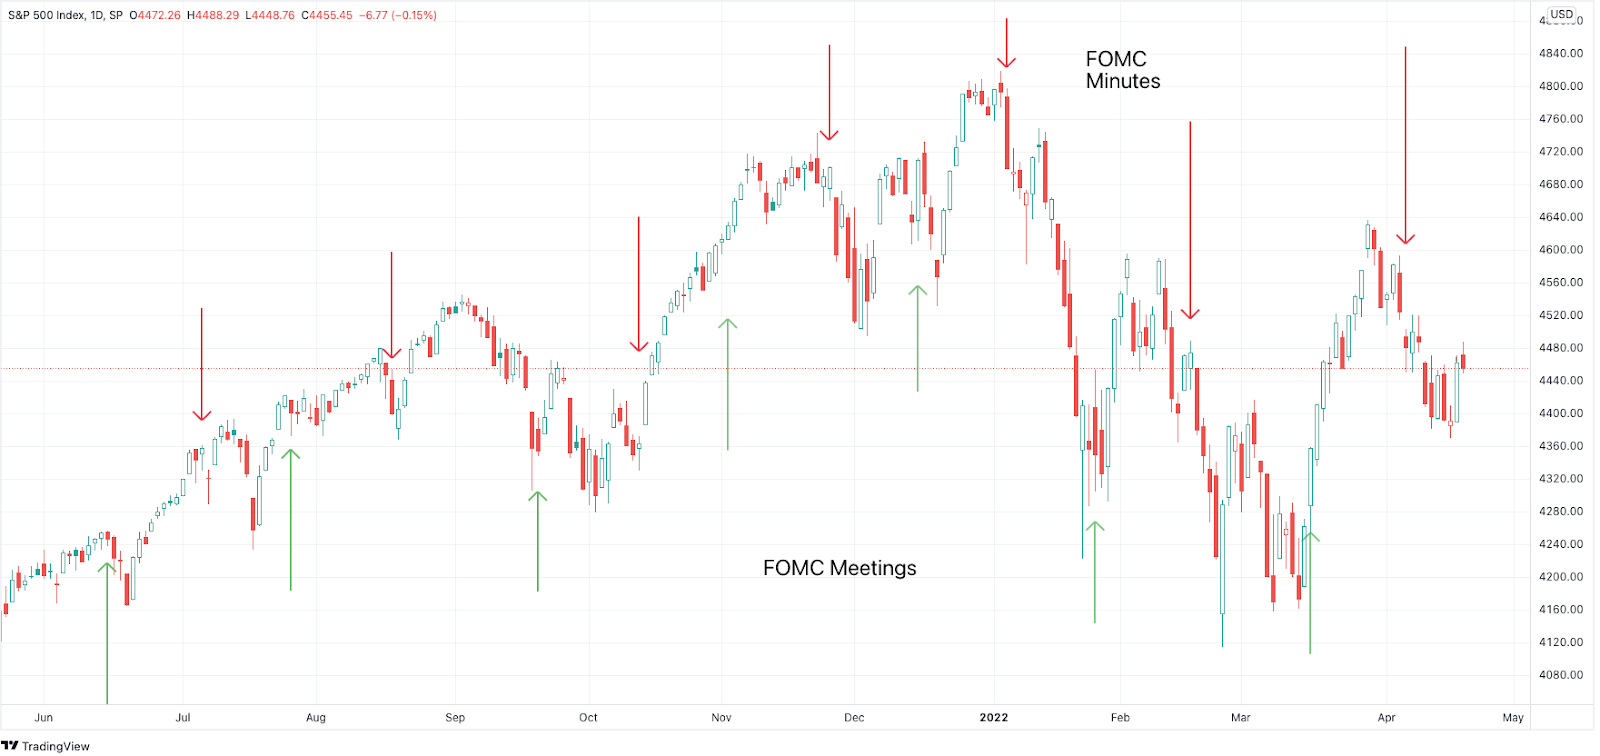
It may be the name of the game for the stock market. At least since the start of 2022, the minutes have been a cause of concern for markets, while the FOMC meetings have resulted in face-ripping, risk-on rallies. The reasons can seem hard to explain, especially since both the minutes and meetings have had seemingly more and more hawkish tones. But that does seem to be the pattern.

The market’s gyration may be easier to understand than they seem. SpotGamma often refers to these sharp rallies as a “Vanna trade” in their daily notes. At the same time, the SpotGamma HIRO Indicator can often depict the hedging activity taking place ahead of these types of macro events.

Fade The Minutes
Chart, line chart

Description automatically generated

Look at the chart above and the timing of the prominent market sell-offs and massive rebounds. The S&P 500 all-time high came on January 4, just one day before the FOMC minutes, and a subsequent drop. The rebound started on January 25, the day of the FOMC meeting, followed by a nearly 5% rally. 

Nearly the same thing happened when the minutes were released on February 16. The S&P 500 dropped sharply again, followed by a massive, almost unexplainable rally that followed the FOMC meeting on March 17. Thus far, the release of the minutes on April 6 has led to a modest decline; whether that decline worsens is yet to be seen. 

The SpotGamma HIRO Indicator shows strong positive Deltas following the FOMC meeting on March 17, as noted in that day’s PM Founder Note, indicating call buying and put selling.

Hedging Activity

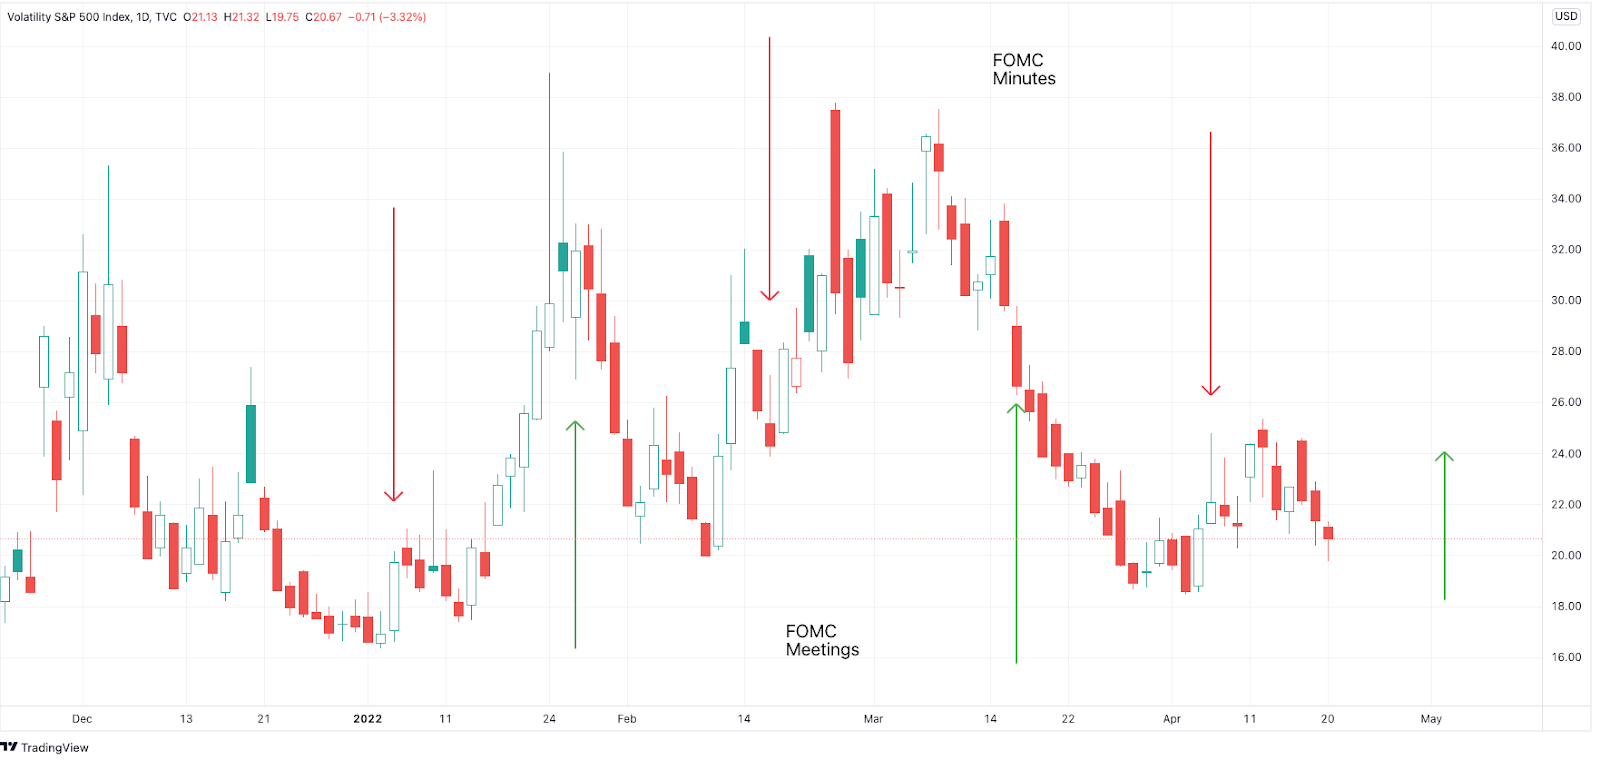
This market volatility may be simpler to explain than it seems, having to do simply with managing risk and using the options market. The VIX index, a measure of market implied volatility, seems ideal for measuring this. Typically, the VIX has been at the lower end of its trading range heading into the Fed minutes and at the higher end of that range heading into the FOMC meetings. 
Chart

Description automatically generated

It would suggest that the market is simply looking to add protection heading into the FOMC meetings by adding puts to guard against the uncertainty of a Fed meeting. The action of investors buying puts results in Market Makers being short puts. To hedge exposure, the Market Maker will then short futures to remain hedged. As the market moves, Market Makers are forced to continually reposition their hedges. If the markets are falling as more investors buy puts, the more futures Market Makers need to short to stay hedged. 

De-Risking Event

Meanwhile, once the FOMC meeting is over, there is a de-risking event, which results in implied volatility dropping. This results in put options losing value quickly, which causes investors to sell their puts and unwind their hedges. This, in turn, results in the Vanna trade, causing Market Makers to buy back their short-future hedges.

For those looking for a short-term market bottom, it may not come until after the FOMC meeting, as investors look to de-risk and unwind their bearish hedges, and the Vanna trade kicks in, giving the stock market another big post-FOMC risk-on rally. 

Share This Article

  • Share
  • Twitter
  • LinkedIn
  • Reddit
  • Facebook

Written by SpotGamma · Categorized: Market Analysis · Tagged: FED, FOMC, hedging, HIRO Indicator, Michael Kramer, vanna

Don’t have an account with SpotGamma?

Choose the plan you want today to view unique support and resistance levels, access Founder’s Notes and expert commentary, daily trading ranges, and entrance into our private Discord.


Primary Sidebar

Related Resources

  • Volatility Has Compressed. What Happens Next?

    Volatility Has Compressed. What Happens Next?

    August 23, 2026
  • Another SpaceX Unlock, and Why $150 Still Caps the Stock

    Another SpaceX Unlock, and Why $150 Still Caps the Stock

    August 20, 2026
  • Options Exchange Monitor — Week of August 15, 2026 (36 SEC notices, 2 CFTC, 0 EDGAR)

    Options Exchange Monitor — Week of August 15, 2026 (36 SEC notices, 2 CFTC, 0 EDGAR)

    August 17, 2026
  • GEX Levels for SPY, QQQ, ES and NQ: Using Index Gamma in Any Product

    GEX Levels for SPY, QQQ, ES and NQ: Using Index Gamma in Any Product

    August 17, 2026
  • How to Trade GEX Levels: A Practical Guide to Gamma-Based Trading

    How to Trade GEX Levels: A Practical Guide to Gamma-Based Trading

    August 17, 2026
  • youtube
  • x
  • Privacy Policy
  • Disclaimer
  • Terms & Conditions
  • Support Center
  • Media
  • Contact Us

©2026 TenTen Capital LLC DBA SpotGamma

All SpotGamma materials, information, and presentations are for educational purposes only and should not be considered specific investment advice nor recommendations. Futures, foreign currency and options trading contains substantial risk and is not for every investor. An investor could potentially lose all or more than the initial investment. Risk capital is money that can be lost without jeopardizing one's financial security or lifestyle. Only risk capital should be used for trading and only those with sufficient risk capital should consider trading. Past performance is not necessarily indicative of future results. Testimonials appearing on this website may not be representative of other clients or customers and is not a guarantee of future performance or success.

View Full Risk Disclosure