• Skip to main content
  • Skip to primary sidebar

SpotGamma™

S&P 500 Stock Market Gamma Trading Levels Based on Options Open Interest

  • About
  • Pricing
  • Academy
  • Resources
    • Tool Demos
    • Case Studies
    • Blog
    • Support Center
    • Daily Report
    • Free Trading Tools
      • Opening Setup Free Report
      • Options Profit Calculator
      • SPX Gamma Exposure
      • Implied Earnings Moves
    • Report Card
  • Login

Market Analysis

Aug 19 2019

JPM Liquidity Rates & VIX Correlation

JPM says that liquidity disappears as VIX spikes. This seems to make intuitive sense. The fact that the VIX is higher means the market is pricing in larger moves which means dealers don’t want to get stuffed with large trades as the market rips through them. This chart doesn’t tell us what level this depth […]

Written by SpotGamma · Categorized: Market Analysis · Tagged: futures liquidity, gamma, JPM, VIX

Aug 19 2019

Gamma Market From 8/16/19

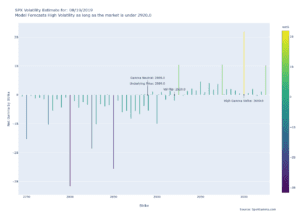
Bar chart of SPX net gamma by strike on 08/19/2019 labeled gamma neutral 2889, vol flip 2920, high gamma strike 3000.

Volatility will continue to reign until (if) the market recaptures 2920. There is a ton of fuel ready to burn and one headline (or tweet) will send the market flying. The only recommendation that is safe here is to not sell any options, being short volatility is very dangerous here, as a >3% rally is […]

Written by tenten · Categorized: Market Analysis · Tagged: futures, market gamma, market makers, open interest, options gamma, S&P500, SPX, SPY

Aug 16 2019

Dealers Running Out of Gas 8/16/19

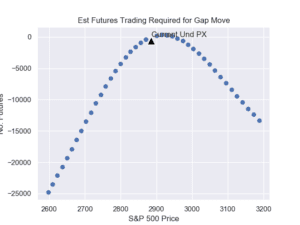
Scatter plot of estimated futures vs S&P 500 price from 2600-3200, peaking near 0 around 2900 with current und PX marked.

After a sharp rally this morning the S&P500 stands at ~2890. This is where dealers buying starts to soften up. You can see their volume profile in the chart below. They were strong buyers up to this level but we calculated 2891 as the level where their buying wanes and 2920 where they flip to […]

Written by tenten · Categorized: Market Analysis · Tagged: futures, gamma, market makers, options, SPX, SPY

Aug 14 2019

Dealer Futures Flow 8/14/19

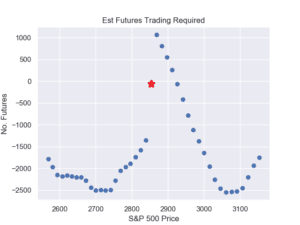
Scatter plot titled Est Futures Trading Required of No. Futures vs S&P 500 Price with a red star near 2850.

Here is a chart estimating the futures action with the S&P500 at 2850. If markets head lower it looks like dealers will sell more futures, compounding the move down. The same works in a rally, but instead of selling those dealers will be buying. All this flips when/if the market moves over the VFLIP line […]

Written by tenten · Categorized: Market Analysis · Tagged: futures, gamma, market makers, options, S&P500, SPX

Aug 13 2019

VFlip Strikes Again 8/13/19

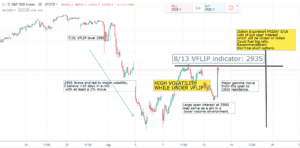
30-minute S&P 500 candlestick chart with VFLIP levels at 2995 and 2935 and option expiration notes.

Like Haden warned us, based on ASDFG levels, on 7/31 markets broke under the VFLIP Volatility Indicator, triggering a market environment market by high volatility. As you can see that proved true with >10 days in a row with a >1% move. With a major options expiration at the end of the week there should […]

Written by tenten · Categorized: Market Analysis · Tagged: open interest, options gamma, SPX, SPY

Aug 12 2019

SpotGamma Trading Levels Vs Nomura

Here is a report from Nomura compared to the same days market forecast from SpotGamma.com. Notice the “zero gamma” levels are the same in both reports at 2935 in the S&P500. We call the “zero gamma” level “volatility trigger”. Using this level can help forecast the level of stock market volatility. Under this market price […]

Written by tenten · Categorized: Gamma Model Output, Market Analysis · Tagged: market gamma, mcelligot, nomura, volatility flip

Aug 12 2019

Nomura: Volatility Crush Market Options Gamma on CNBC

Nomura analyst on CNBC discussing how dealer gamma effects the equity market. He mentions the large open interest in the VIX (“50 Cent”) and how a volatility crush could spur an equity rally. This is because (as seen through the SpotGamma model) a drop in volatility forces dealers to rehedge through buying stocks. As the […]

Written by tenten · Categorized: Market Analysis · Tagged: market gamma, mcelligott, nomura, volatility

Aug 09 2019

Volatility Trigger INDICATOR KEEPING LID ON MARKET 8/9/19
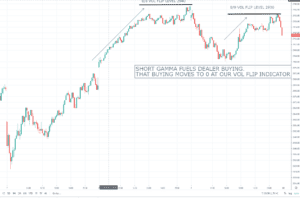
Candlestick chart with 8/8 vol flip level 2940, 8/9 vol flip level 2930, and a short-gamma dealer buying note.

SpotGamma calculates the market level at which options dealers gamma position flips from long to short. We call this the “VOLATILITY TRIGGER” indicator. Below this S&P500 price dealers trading can increase market volatility, and over this level their trading may damped volatility. You can see over the last two days the markets drove hard into […]

Written by tenten · Categorized: Market Analysis · Tagged: dealer buying, gamma flip, volatility trigger, zero gamma

Aug 07 2019

Stock Markets Gamma Squeeze 8/6/19

After several days of selling the S&P500 and other stock markets gamma squeeze higher. It appears to be a gamma squeeze play as options dealers were most likely forced to buy back short hedges. As implied volatility (e.g. VIX) goes down and put options are sold the delta of out of the money put options […]

Written by tenten · Categorized: Market Analysis

Aug 05 2019

SpotGamma Update 8/5/19

30-minute candlestick chart of SPX showing a steep decline with an arrow labeled Short Gamma + Terrible Liquidity.

Our market model has dealers short gamma with the market below 2950. This means that dealers will push the market further in its prevailing direction. If the market is selling then dealers will push is lower. It also means that when the market snaps back up it will be a violent move.

Written by tenten · Categorized: Market Analysis

  • « Go to Previous Page
  • Go to page 1
  • Interim pages omitted …
  • Go to page 69
  • Go to page 70
  • Go to page 71
  • Go to page 72
  • Go to Next Page »

Primary Sidebar

SpotGamma-Subscriber-Signup-Banner

  • The Mechanics Behind Thursday’s Selloff
  • Hedges Rolled Down, Not Off: Brent Kochuba on Excess Returns
  • The Volatility Trap: What Options Markets Reveal About the Next Two Weeks
  • Tech Vol Collapsed, Put Skew Held Rich: Options Action Live on CNBC
  • Gamma Guy: The 0DTE Flow That Usually Pins the Index Didn’t Arrive
  • youtube
  • x
  • Privacy Policy
  • Disclaimer
  • Terms & Conditions
  • Support Center
  • Media
  • Contact Us

©2026 TenTen Capital LLC DBA SpotGamma

All SpotGamma materials, information, and presentations are for educational purposes only and should not be considered specific investment advice nor recommendations. Futures, foreign currency and options trading contains substantial risk and is not for every investor. An investor could potentially lose all or more than the initial investment. Risk capital is money that can be lost without jeopardizing one's financial security or lifestyle. Only risk capital should be used for trading and only those with sufficient risk capital should consider trading. Past performance is not necessarily indicative of future results. Testimonials appearing on this website may not be representative of other clients or customers and is not a guarantee of future performance or success.

View Full Risk Disclosure