• Skip to main content
  • Skip to primary sidebar

SpotGamma™

S&P 500 Stock Market Gamma Trading Levels Based on Options Open Interest

  • About
  • Pricing
  • Academy
    • FREE TRADE PLANNING WEBINAR
  • Resources
    • Tool Demos
    • Case Studies
    • Blog
    • Support Center
    • Daily Report
    • Free Trading Tools
      • Opening Setup Free Report
      • Options Profit Calculator
      • SPX Gamma Exposure
      • Implied Earnings Moves
    • Report Card
  • Login

Market Analysis

Sep 20 2019

Negative Gamma in Oil Markets

Bloomberg posts an article about the effects of negative gamma in oil markets. Its full of hyperbole, but portrays the general idea right. Traders frenetically sell futures to manage their options exposure; that drives down prices and brings more options into the danger zone; dealers are then forced to sell even more crude contracts. This […]

Written by SpotGamma · Categorized: Market Analysis · Tagged: negative gamma, oil

Sep 19 2019

Gamma & Spy Going Ex-Div

Tomorrow SPY trades Ex-Div which means if you own SPY you will collect the dividend. Here is a brief thought expermient on why Ex-Div is bullish for SPY: If you are short SPY you have to pay out the dividend. If you are short ITM calls you will probably be exercised. If you own ITM […]

Written by SpotGamma · Categorized: Market Analysis

Sep 17 2019

SPX Pin Risk Exemplified

Two-panel SPX INDEX chart with 2-min candlesticks near 3000 and a red-circled option volume spike at 2996.

The last two days have had large volume at the 3000 strike in the S&P 500 and this has held the market in a very tight range around….3000. With the Fed FOMC tomorrow volume is very low, so all that is left is for dealers to pin the market where all the options volume is. […]

Written by SpotGamma · Categorized: Market Analysis · Tagged: pin risk

Sep 16 2019

Option Expiration Roll Starting?

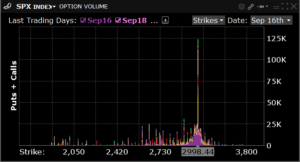
Bar chart of SPX puts and calls volume by strike with a large spike near 2998 on Sep 16.

Lots of volume at the 3k strike today, but so far only about ~45k of the ~125k traded expire in the next 3 months. Our tables from last night show about 330k of total OI at the 3000 strike for September. Last months CBOE Buywrite Index strike (BXM) was 2895, so those will be deep […]

Written by SpotGamma · Categorized: Market Analysis · Tagged: BXM index, call rolling, cboe, options expiration

Sep 16 2019

Saudi Oil Attack Options Gamma

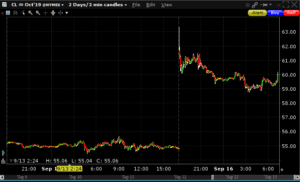
2-minute candlestick chart of CL Oct'19 futures showing a sharp rise from 55 to 63 around September 12.

Here is a quick snapshot after the Saudi Oil attack – options gamma is still quite long with over $1bn long gamma per point in the S&P500. This may have had an effect on muting or “deleveraging” the reaction to the news about the Saudi Oil attack. There was a very large move in crude […]

Written by SpotGamma · Categorized: Market Analysis · Tagged: FOMC, futures, gamma, saudi oil attack

Sep 13 2019

Large Options Gamma Roll 9/20/19

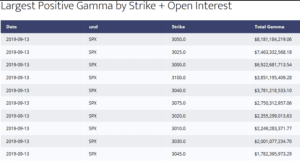
Table of largest positive gamma by strike for SPX on 2019-09-13, with 3050.0 showing $8.18 billion total gamma.

September 20th has a large options gamma roll ahead in the S&P500 (SPX, SPY). There are substantial call and put positions and there was obviously a lot of movement up this month. We also have the Fed which is expected to lower rates by 25 bps. This could provide a market catalyst just as large […]

Written by SpotGamma · Categorized: Market Analysis · Tagged: call gamma, options gamma, options roll

Sep 05 2019

How Options Trading Influences Market

MES 2-minute candlestick chart with Ramp annotation near 2979.50 and options volume bar chart showing 3k BOT spike at 2979.

Today had an interesting movement in the S&P500 (SPX, SPY) where the market essentially went completely vertical. It appeared to be caused by options hedging, as the 3000 strike was very active especially in tomorrows expiration. The theory is that someone is buying calls (could be closing a short, or just getting long the 3000 […]

Written by SpotGamma · Categorized: Market Analysis

Sep 05 2019

Short Gamma vs Long Gamma

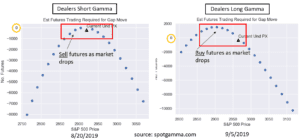
Two scatter plots comparing dealers short gamma on 8/20/2019 and long gamma on 9/5/2019 for S&P 500 futures.

As dealers were short gamma for most of August they have moved to long gamma. Below is a chart comparing their theoretical behavior in each gamma regime. You can see when dealers are short gamma and the market is falling they are trading with the market, fueling the drop. Conversely when long gamma they are […]

Written by SpotGamma · Categorized: Market Analysis · Tagged: dealer gamma, gamma trap, long gamma, options gamma, short gamma

Sep 03 2019

Starting Short Gamma – September Market Outlook
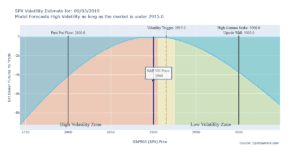
Volatility estimate chart for SPX on 09/03/2019 with high volatility zone below 2915 and price at 2900.

There are several catalysts in September that could cause the same volatility we saw in August. So far this morning there is appears that China Trade has made no headway and futures are around 2900. As you can see in the chart below that has the SPX & SPY markets starting short gamma and therefore […]

Written by SpotGamma · Categorized: Market Analysis · Tagged: options expiration, options market, short gamma, volatility

Aug 30 2019

Long Gamma Kick Save 8/30/2019

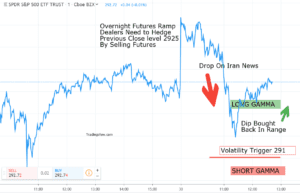
Line chart of SPDR S&P 500 ETF TRUST with annotations for Iran news drop, long gamma rebound, and 291 volatility trigger.

There have been lots of short gamma charts lately but today’s action looked like a long gamma kick save. News about Iranian enrichment pushed the market down at ~11EST and there was a decent drop to ~291 – a dip that was bought. The previous close was 292.5 and we model that because of the […]

Written by SpotGamma · Categorized: Market Analysis · Tagged: long gamma, options gamma

  • « Go to Previous Page
  • Go to page 1
  • Interim pages omitted …
  • Go to page 67
  • Go to page 68
  • Go to page 69
  • Go to page 70
  • Go to page 71
  • Go to page 72
  • Go to Next Page »

Primary Sidebar

SpotGamma-Subscriber-Signup-Banner

  • CPI Preview: Can Cooling Inflation Stabilize Stocks—or Trigger Another Volatility Shock?
  • The Mechanics Behind Thursday’s Selloff
  • Hedges Rolled Down, Not Off: Brent Kochuba on Excess Returns
  • The Volatility Trap: What Options Markets Reveal About the Next Two Weeks
  • Tech Vol Collapsed, Put Skew Held Rich: Options Action Live on CNBC
  • youtube
  • x
  • Privacy Policy
  • Disclaimer
  • Terms & Conditions
  • Support Center
  • Media
  • Contact Us

©2026 TenTen Capital LLC DBA SpotGamma

All SpotGamma materials, information, and presentations are for educational purposes only and should not be considered specific investment advice nor recommendations. Futures, foreign currency and options trading contains substantial risk and is not for every investor. An investor could potentially lose all or more than the initial investment. Risk capital is money that can be lost without jeopardizing one's financial security or lifestyle. Only risk capital should be used for trading and only those with sufficient risk capital should consider trading. Past performance is not necessarily indicative of future results. Testimonials appearing on this website may not be representative of other clients or customers and is not a guarantee of future performance or success.

View Full Risk Disclosure