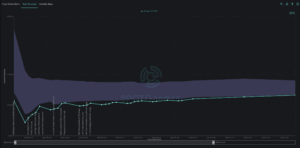
SPX ended the week at a major SpotGamma support level of 6,450, driven by a combination of volatility compression, stabilizing dealer hedging flows, and the power of large options positioning. This week followed the trajectory outlined in our Founder’s Note on Monday morning: a benign CPI reading sent volatility even lower, and the SPX rose from 6,360 […]
SpotGamma Weekly
Market Drifts Through “Death Valley” Vols
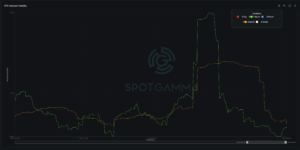
The S&P 500 delivered a week that looked dramatic at times, but ended up just drifting slightly — closing up 1.8% after a wild ride. While volatility spiked early in the week from tariff deadlines and semiconductor earnings disappointments, IV quickly collapsed as 0DTE flows reasserted control. This vol crush became a self-reinforcing tailwind for […]
From “Zombie Market” to Vol Awakening
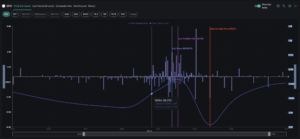
What a difference a week makes. The S&P 500 went from consistently hitting all-time highs with 6,450 touched on Wednesday to close Friday down 1.6% to 6,238.This dramatic shift from “zombie market” to spiking realized volatility exemplifies the need for protective puts and/or VIX calls as insurance, as we highlighted in the daily pre-market Founder’s Notes throughout […]
Animal Spirits Roar as Market Catalysts Loom

This week delivered a fascinating mix of meme stock chaos, trade deal optimism, and mega tech earnings keeping traders on their toes despite unusually calm waters for the broader market. The S&P 500 ultimately gained ground, closing at all-time-highs, just below the pivotal SPX 6,400 gamma strike. Call option volumes exploded this week alongside broader […]
July OPEX Opens the Window of Weakness
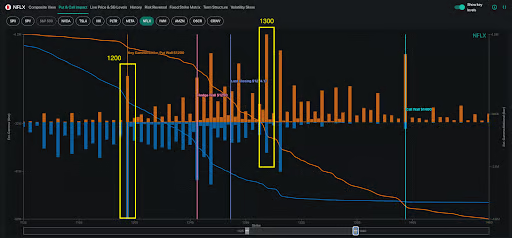
This week delivered everything from mini-flash crashes to meme stock explosions, capped off with a July OPEX that reinforced our thesis about dangerously complacent volatility expectations. Our key levels proved their worth again this week: resistance at 6,325 limited upside attempts, and support zones at 6,250 and 6,200 provided reliable bounce points. The 6,200 pivot […]