Strong 0DTE Support Lifts the Market to Record Highs The S&P 500 kicked off 2026 by grinding through a week of macro data releases to finish at fresh all-time highs on Friday. SPX closed at 6,966, up from the 6,902 open on Monday, after finding critical support in the 6,890–6,900 zone multiple times throughout the […]
SpotGamma Weekly
Record 0DTE volume reshapes the S&P 500
Record 0DTE Volume in 2025 Has Changed the Game We wrapped up 2025 with the S&P 500 up 18% for the year—a solid result in the face of tariff headlines, global conflicts, and inflation concerns. One of the major options market stories of the past year has been the growing role of 0DTE options: same-day expiration […]
Subdued Volatility and the Setup Into Year-End
Subdued Vol Meets Negative Gamma Weakness in AI-related stocks dominated market headlines last week, most notably for Oracle and Broadcom. This pushed the market downward, before the rebound on Thursday and Friday. Despite the market trending down for three consecutive days, implied volatility remained surprisingly subdued: put skew remained average, and ATM implied volatility sat […]
FOMC Reset: Vol Crushes, Stocks Lift Higher

Last week began with quiet anticipation of Wednesday’s FOMC. When the Fed announced the 25 basis point rate cut and Treasury bill purchases, the reaction was immediate. Equities surged, with the SPX breaking out above our 6,845 Volatility Trigger to approach all-time-highs near the 6,900 resistance level. The options market had priced in meaningful event-related volatility surrounding FOMC, and […]
How the Options Market is Positioning for FOMC
Markets hovered near all-time highs last week as traders eagerly await next week’s FOMC. The SPX traded in a tight 6,800-6,900 range, while volatility compressed to multi-month lows: VIX dropped 15% this week to 15.4, experiencing some of the lowest values since September. This is a trend we’re watching closely: Softer demand for volatility (options) […]
FOMC in Focus After Market’s Thanksgiving Feast
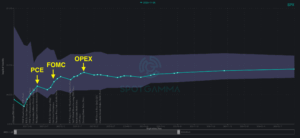
Post-OPEX Dynamics Drive Thanksgiving Week Rally The shortened Thanksgiving holiday week delivered exactly what we outlined in our Monday morning Founder’s Note: a powerful post-OPEX rally driven by put option decay and volatility compression. The week marked a significant bullish pivot for U.S. equities, with the S&P 500 rallying from 6,636 to 6,849—a gain of over […]
Negative Gamma Fuels Extreme Volatility

There’s really only one way to summarize the past few days: “What a week!” Markets delivered some of the most extreme intraday swings of the year, culminating in Thursday’s violent selloff and Friday’s equally dramatic reversal—one of the sharpest two-day sequences we’ve seen in 2025. As of Thursday, the S&P 500 was on track for the worst […]
All Eyes on NVDA as Volatility Spikes

From Market Euphoria to “Elevator Down” Markets experienced a dramatic reversal last week. Monday began with bullish momentum after the government shutdown deal was reached, yet by Thursday the market was facing intense selling pressure. Notably, SPX broke below the critical 6,800 risk pivot level we emphasized daily in our Founder’s Notes, triggering higher volatility. As […]
SPX Down, Vol Up: What Makes Last Week’s Selloff Different
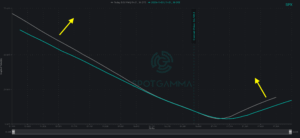
The market experienced a meaningful shift this week as SPX declined nearly 3% from the all-time highs of October 29, closing Friday at 6,729. What began as fluid, transient price action evolved into more concerning market dynamics by the end of the week. The week’s volatility behavior differed markedly from the tariff-induced selloff on October […]
The Market’s Balancing Act: Euphoria vs. Anxiety
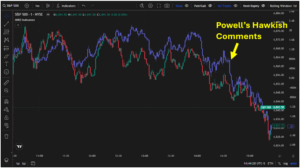
Last week, SPX tested all-time highs at 6,920 while also reaching lows near the key gamma strike of 6,815 — a journey that balanced euphoria and anxiety. Wednesday morning began with a major risk alert from our AM Founder’s Note, which was validated over the next two days: the combination of the “spot up, vol up” […]