The market is overwhelmingly expecting the Fed to raise rates by 25 basis points Wednesday. That means the hike itself may not be what moves stocks.
The bigger risk is what the Fed says comes next.
Wednesday is also a Summary of Economic Projections meeting, which means investors will get an updated Fed “dot plot” — individual policymakers’ projections for where they believe interest rates should be in the years ahead.
With another hike already partly reflected in the futures curve, a meaningful shift in those projections could matter more than Wednesday’s decision itself. And the timing is particularly interesting: Wednesday’s FOMC falls between VIX expiration that morning and a massive options expiration on Friday.
Here’s what the options market is telling us heading into the decision.
The hike is already priced
The Fed announces its decision Wednesday, Sept. 16, with the funds rate currently at 3.50–3.75% after July’s hold. Markets overwhelmingly expect a 25bp hike. CME FedWatch puts the probability around 92%, while SpotGamma’s own read as of Friday was 87%. Polymarket sits in the 85–90% range. The futures curve also carries rates around 4.1% by December and ~4.6% by September 2027, meaning additional tightening is already partly reflected in markets.
That makes the path of future rates — not simply Wednesday’s hike — the potential surprise.
The macro backdrop raises the stakes. The 10-year Treasury yield is testing 5%, near its highest level since October 2023. WTI is around $105 and Brent is approaching $110 as the Strait of Hormuz closure continues.
Yet equities have absorbed much of that uncertainty. SPX has slipped below 7,600 but remains only about 2% below its highs, while VIX is trading around 17 after closing Friday at 15.84.
So far, markets are taking a significant amount of macro uncertainty in stride.
What the options market is pricing
The implied FOMC-day move is just under ±1%.
That translates to roughly 75 points in SPX, close to the historical average for an FOMC day. Notably, options are not pricing an unusually large fear premium despite the prospect of a rate hike amid an oil shock.
But it’s important to distinguish Wednesday’s implied move from the rest of the week.
The ~1% estimate applies to the FOMC-day expiration. Through Friday, the options market implies a move closer to 120 SPX points — considerably more movement than realized volatility has produced recently.
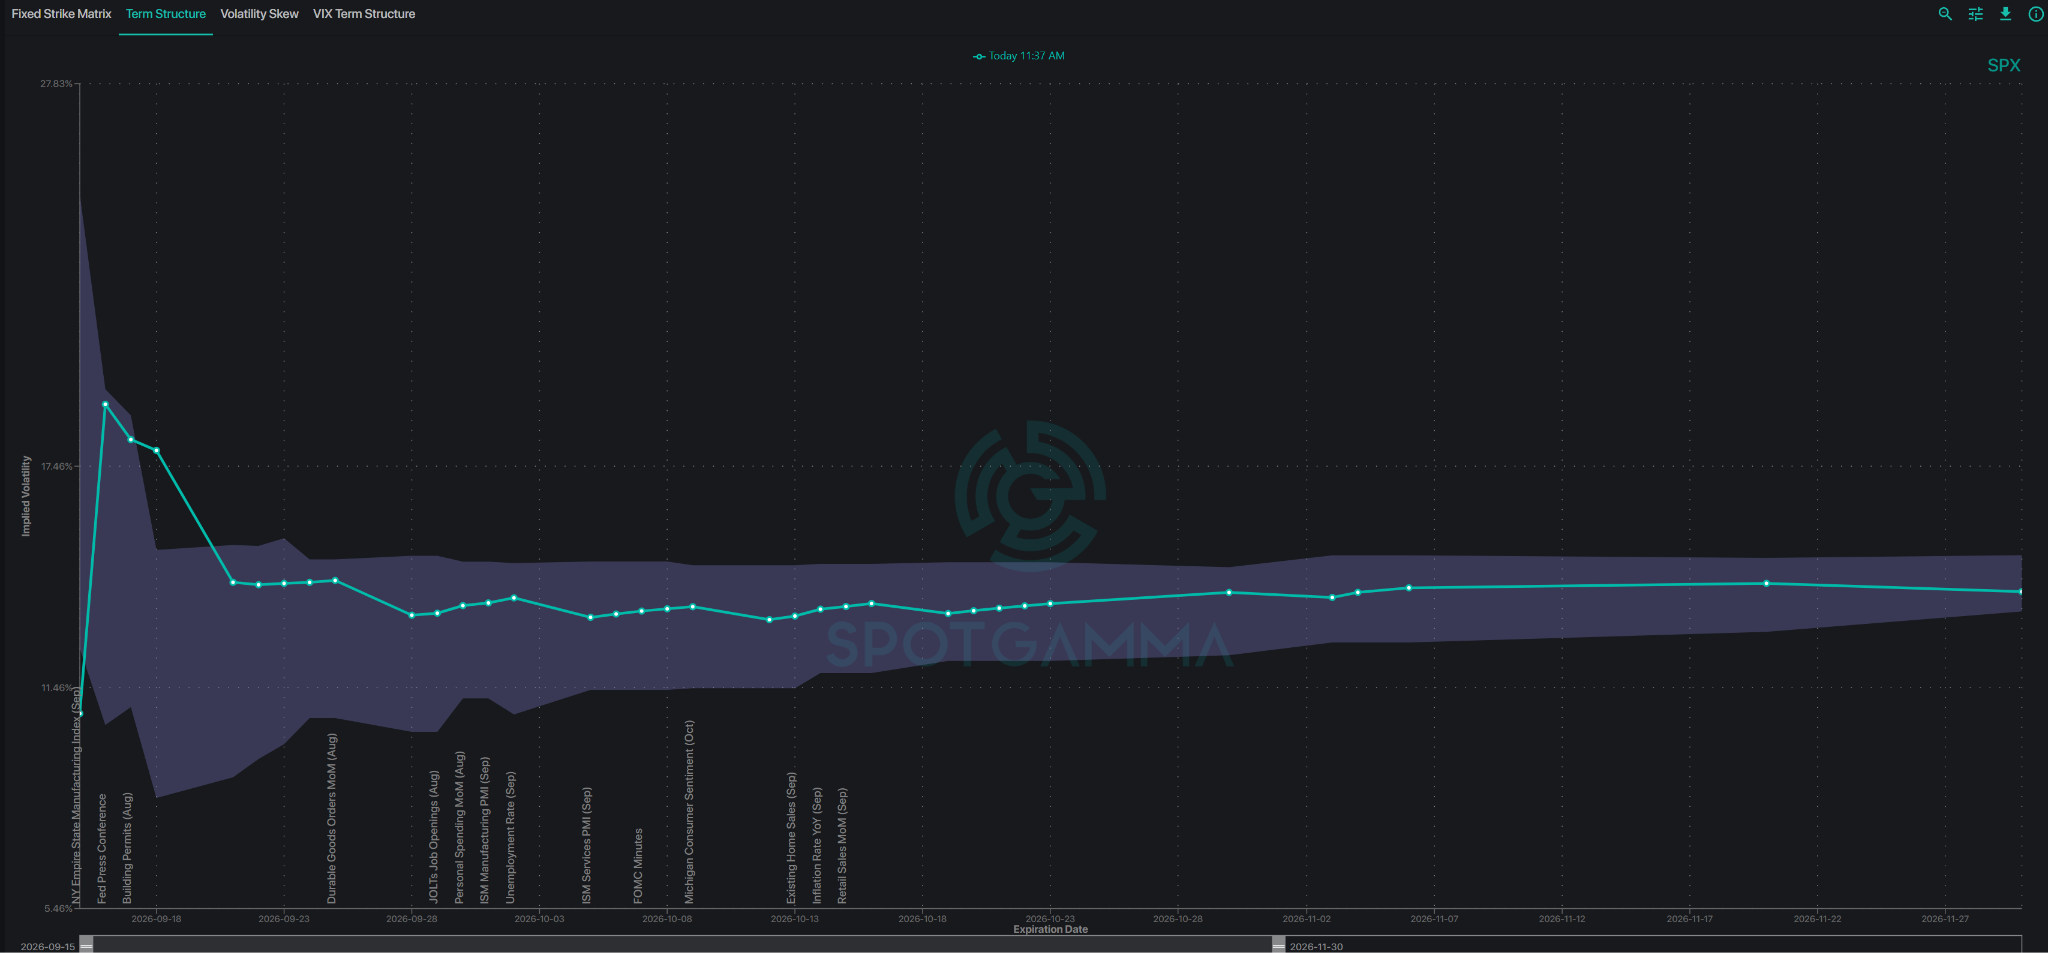
Until recently, volatility had been remarkably cheap. SPX IV Rank fell to 3, while IWM reached just 0.7 — cheaper than almost any point over the past year — despite CPI, FOMC and quarterly expiration all arriving within a short window.
That has started to change. IWM and SPY IV Rank hit 1 roughly a week ago, but downside puts have since attracted buyers in both. QQQ has also shifted from call-leaning to put-leaning as implied volatility has risen.
Volatility lifting off the floor matters because it signals that investors are finally paying for protection — and that can change dealer positioning and market behavior.
Where institutions are hedging
Perhaps the more interesting signal is where large traders are buying protection.
Recent large VIX call purchases have been concentrated in October and November — not September:
- 140K October 28 calls at $0.92
- 128K November 31 calls at $0.94
- 143K November 34 calls at $0.89
These are far out-of-the-money calls purchased in significant size and positioned well beyond this week’s FOMC meeting. That suggests the hedging is aimed less at a one-day Fed shock and more at the possibility of a more sustained increase in volatility extending into the fall.
Why VIX expiration matters
There is another important piece of Wednesday’s setup that is easy to miss.
September VIX futures and options settle Wednesday morning, Sept. 16 — exactly 30 days before the Oct. 16 SPX expiration. The expiring VIX futures contract stops trading at 9:00 a.m. ET, roughly five hours before the 2:00 p.m. Fed decision, while expiring September VIX options cease trading at Tuesday’s close.
That means September VIX options cannot provide exposure to the market reaction following the FOMC announcement. They will already have settled.
The VIX exposure that can capture the post-Fed reaction therefore lives farther out on the curve — which makes the large October and November call activity particularly interesting. The current VIX positioning also creates some important levels for Wednesday.
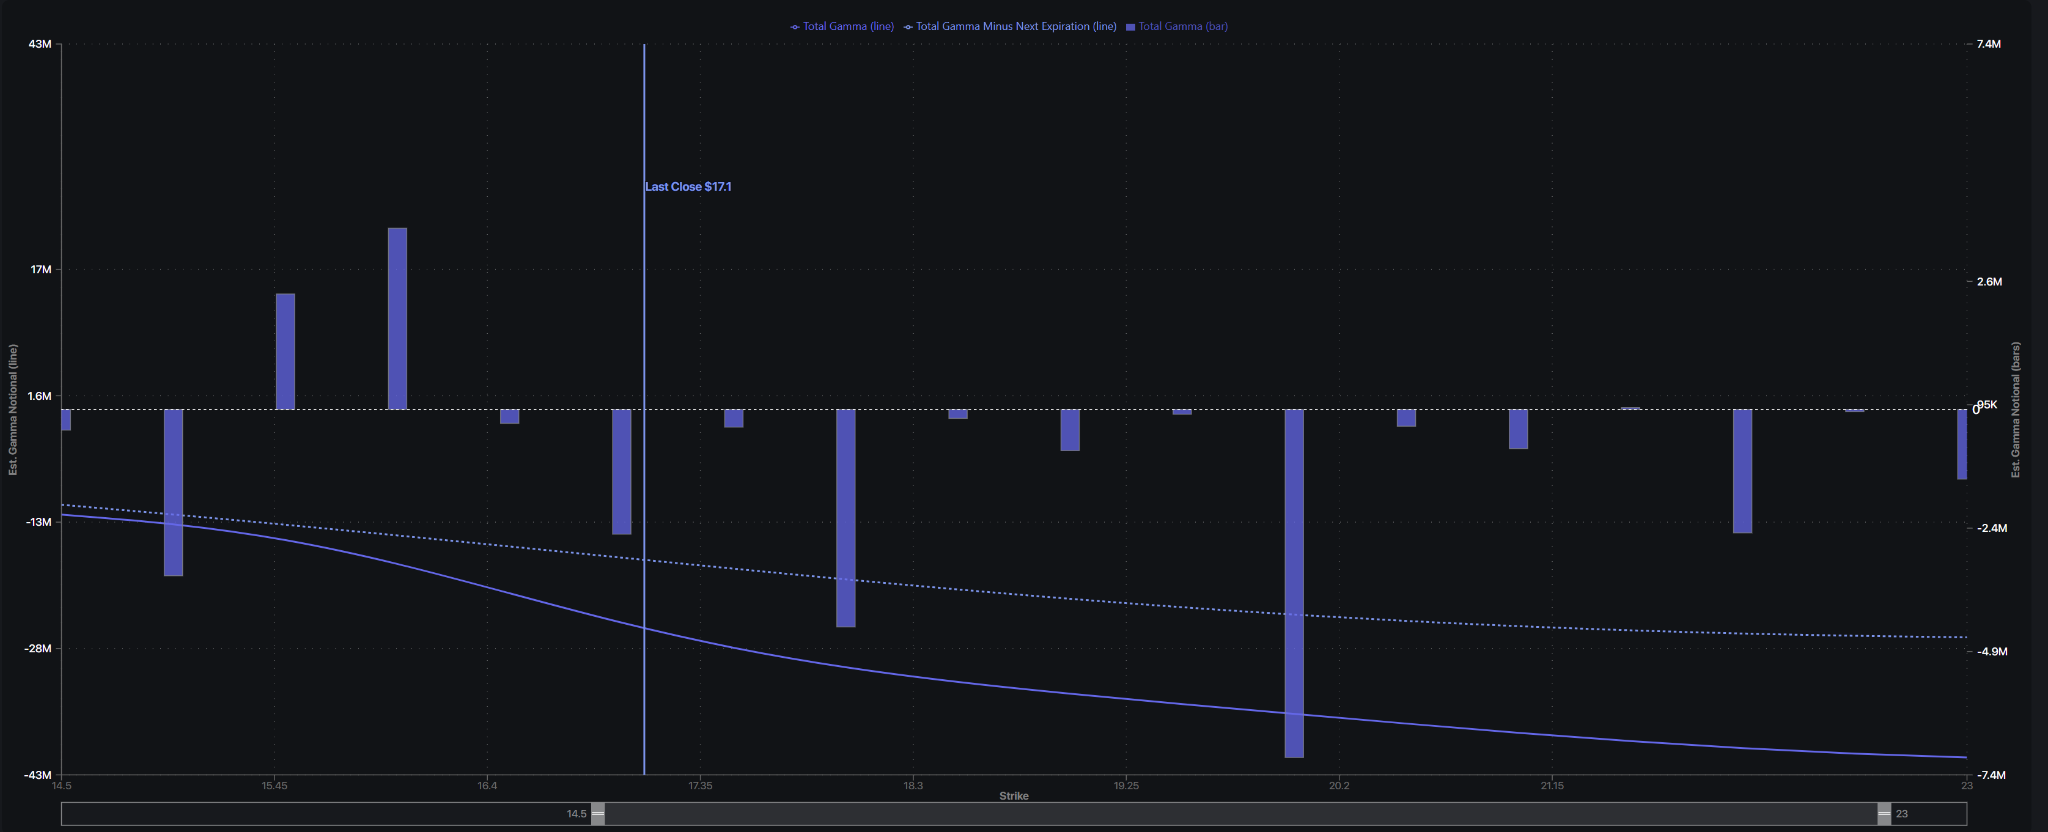
SpotGamma’s synthetic VIX open-interest map shows dealers carrying positive gamma exposure around the 16 strike, which could act as a floor if volatility moves lower.
The dynamic changes above 18. With negative gamma building above 18, a move through that level could trigger dealer hedging that helps accelerate a move toward 20.
The dashed line on the chart isolates total gamma after removing the next expiration — Wednesday’s settlement — giving a clearer view of the positioning that remains after the FOMC.
Friday may be the bigger structural event
Wednesday gets the headlines, but Friday’s quarterly options expiration may have the larger structural impact on the market.
SpotGamma estimates roughly $2 trillion of delta notional expires Friday, compared with approximately $2.1–$2.2 trillion during the record September 2024 expiration.
That is substantially below some headline estimates approaching $9 trillion because those figures count every contract as 100 shares, including deeply out-of-the-money options likely to expire worthless.
More important than the headline number is where the gamma sits.
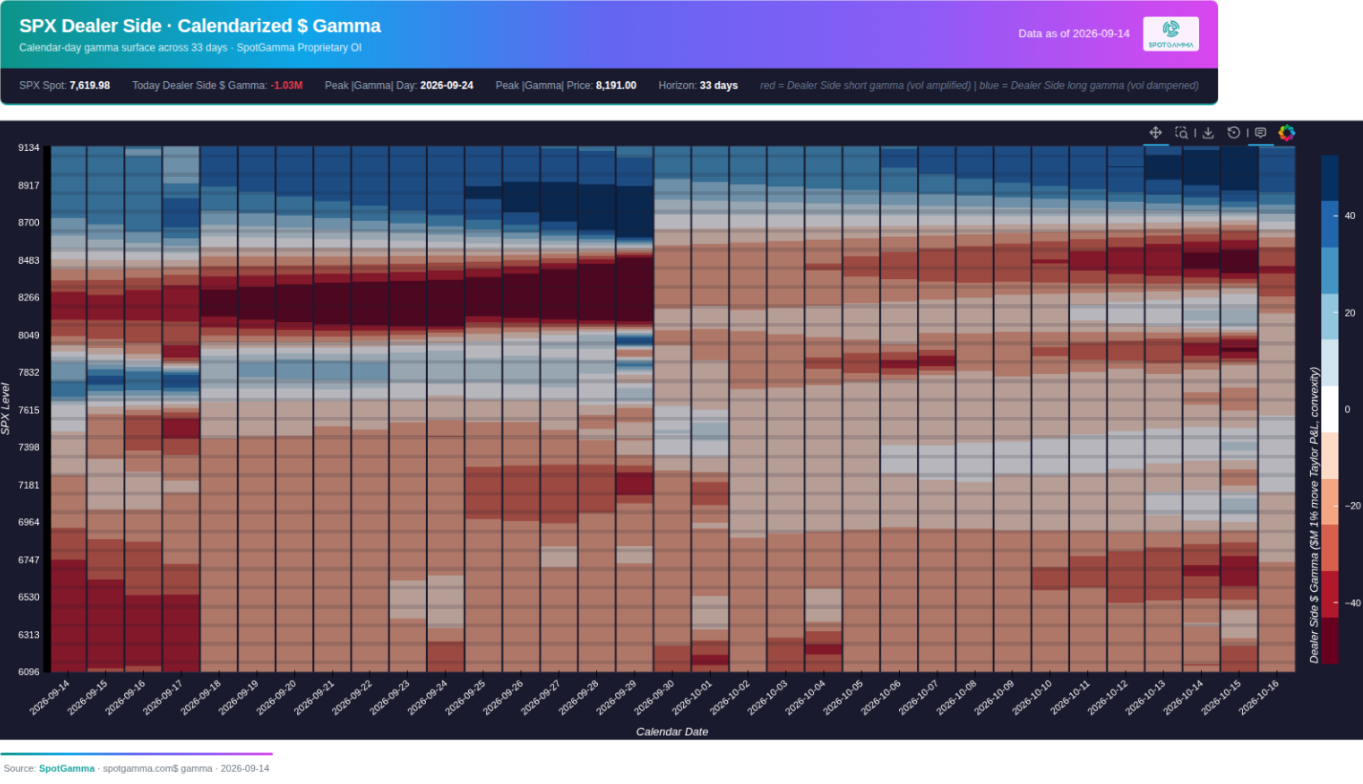
The map shows a pocket of positive gamma building above roughly 7,650 into Friday. A move back above that area would put SPX into a more stable positioning regime. Below approximately 7,550, negative gamma becomes increasingly important. That creates a key dividing line around SPX 7,600.
Above 7,600, the S&P sits around positive gamma, with 0-DTE sellers helping suppress intraday moves. Below 7,600, SpotGamma’s five-day projection remains negative with no meaningful trough until approximately 7,350.
In a negative-gamma environment, dealer hedging can work in the same direction as the market: as stocks fall, dealers may need to sell futures, potentially amplifying the move.
Below 7,600, a move toward VIX 20+ could therefore develop quickly.
Friday’s expiration should remove roughly 40% of active positions. SpotGamma estimates that could reduce dealer negative gamma from approximately $8–10 billion toward $4 billion. In other words, expiration could significantly reduce the current negative-gamma pocket — but it won’t eliminate it entirely.
Three paths through Friday
The Fed decision matters, but the combination of the dot plot, yields and dealer positioning will likely determine whether Wednesday’s move extends into Friday.
1. Hike + hawkish dots
The Fed hikes as expected, but policymakers signal a higher or longer rate path than markets anticipate.
Treasury yields push through 5%, correlations rise and SPX loses 7,600. That would put the index deeper into the negative-gamma pocket, with limited positioning support until roughly 7,350.
2. Hike + balanced dots — our base case
The Fed delivers the expected 25bp hike without materially increasing expectations for additional tightening.
The initial ±1% FOMC move gets absorbed, implied volatility comes in, and Friday’s expiration removes a meaningful amount of positioning from the market.
That would support a transition toward a calmer volatility regime after OPEX.
3. Hold — the ~10% tail
The Fed unexpectedly holds rates.
That could provide immediate relief to rate volatility and act as a clearing event for equities, opening the door to a quick move back toward SPX 7,700–7,800 into Friday’s expiration.
Positive gamma above the market could then begin to limit the upside.
The bottom line
Wednesday’s rate decision may be the least surprising part of Wednesday’s FOMC.
A 25bp hike is already overwhelmingly expected, and additional tightening is partly reflected in the futures curve. The bigger question is what the dot plot says about where rates go from here.
At the same time, the options market is creating an unusual sequence of events: September VIX expires before Powell’s successor speaks, large volatility hedges are concentrated in October and November, and roughly $2 trillion of delta notional rolls off Friday.
That leaves SPX 7,600 as the key level through the week. Above it, positive gamma should help contain volatility. Below it, dealer positioning becomes increasingly negative, creating the potential for larger moves toward 7,350 and VIX 20+.
The hike is priced. The path after the hike is where the surprise lies.