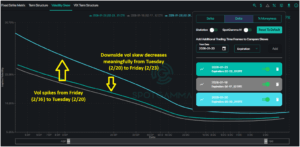
Last week began with fear dominating market sentiment: analysts widely attributed Tuesday’s 2% SPX selloff to Greenland worries and tariff threats. As we pointed out in last weekend’s newsletter, traders had begun hedging against downside risk as put skew increased and volatility premiums rose. However, the quick turnaround back to SPX 6,900 seemed to erase any […]
OPEX
Defensive Positioning Emerges as Market Rallies

Traders Turn Defensive In the Face of Market’s Climb SPX tested fresh all-time highs last week, with positive gamma providing guardrails for the broader market. In the face of headline noise—from criminal investigations into Powell to Iran-related escalation—the market absorbed every dip, with the 6,890 Risk Pivot level from Monday’s AM Founder’s Note holding firm. However, increasing put skew and […]
Vol Stays Quiet as SPX Reaches All-Time Highs
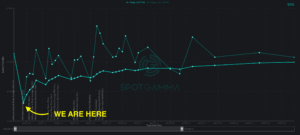
Strong 0DTE Support Lifts the Market to Record Highs The S&P 500 kicked off 2026 by grinding through a week of macro data releases to finish at fresh all-time highs on Friday. SPX closed at 6,966, up from the 6,902 open on Monday, after finding critical support in the 6,890–6,900 zone multiple times throughout the […]
Record 0DTE volume reshapes the S&P 500
Record 0DTE Volume in 2025 Has Changed the Game We wrapped up 2025 with the S&P 500 up 18% for the year—a solid result in the face of tariff headlines, global conflicts, and inflation concerns. One of the major options market stories of the past year has been the growing role of 0DTE options: same-day expiration […]
Subdued Volatility and the Setup Into Year-End
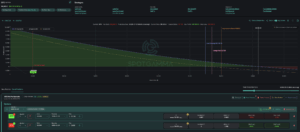
Subdued Vol Meets Negative Gamma Weakness in AI-related stocks dominated market headlines last week, most notably for Oracle and Broadcom. This pushed the market downward, before the rebound on Thursday and Friday. Despite the market trending down for three consecutive days, implied volatility remained surprisingly subdued: put skew remained average, and ATM implied volatility sat […]
FOMC Reset: Vol Crushes, Stocks Lift Higher

Last week began with quiet anticipation of Wednesday’s FOMC. When the Fed announced the 25 basis point rate cut and Treasury bill purchases, the reaction was immediate. Equities surged, with the SPX breaking out above our 6,845 Volatility Trigger to approach all-time-highs near the 6,900 resistance level. The options market had priced in meaningful event-related volatility surrounding FOMC, and […]
March OPEX Effect: Put Maxed

In this episode of the OPEX Effect we discuss how the stock market turned right at February VIX expiration resulting in a 10% SPX market crash into this weeks massive March OPEX. Brent flags how put values are “maxed out” into OPEX, and why that dynamic combines with 5,500 – 5,565 as a major support […]
The OPEX Effect: August 2024 | Behind the Scenes of the Recent Market Volatility
In this episode of OPEX Effect, we dive into the recent market volatility and its connection to options flows. We discuss the sudden VIX spike to 65, examining the factors that led to this extreme event, including low liquidity, the unwinding of correlation trades, and the impact of zero-day options. We explore how the market […]
How We Nailed the Volatile Markets Last Week—And How You Can Too
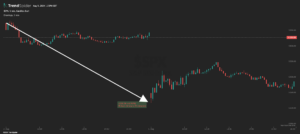
How We Nailed the Volatile Markets Last Week—And How You Can Too Monday January 01 1999 Try SpotGamma HIRO Indicator for Free Real-time options data See when options drive stocks 0DTE filter for short-term trades Get Started Free Our Critical Market Guidance The past week has been a roller coaster for the stock market, with […]
Blazing Hot IWM/Russell 2000 (R2k): How Options Insights Helped to Navigate the Small-Cap Madness
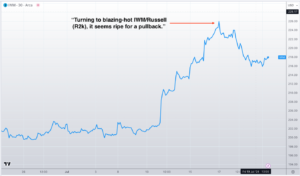
How Option Flows Helped to Navigate the Small-Cap Madness Monday January 01 1999 Try SpotGamma HIRO Indicator for Free Real-time options data See when options drive stocks 0DTE filter for short-term trades Get Started Free Key Takeaways The unprecedented +12% surge in IWM/Russell 2000 (R2k) marked the most overbought condition for any major US Index […]