• Skip to main content
  • Skip to primary sidebar

SpotGamma™

S&P 500 Stock Market Gamma Trading Levels Based on Options Open Interest

  • About
  • Pricing
  • Academy
  • Resources
    • Tool Demos
    • Case Studies
    • Blog
    • Support Center
    • Daily Report
    • Free Trading Tools
      • Opening Setup Free Report
      • Options Profit Calculator
      • SPX Gamma Exposure
      • Implied Earnings Moves
    • Free Training
    • Report Card
  • Login

Market Analysis

Oct 20 2021

The SEC on GME: SpotGamma’s Analysis

Written by SpotGamma · Categorized: Market Analysis

Oct 20 2021

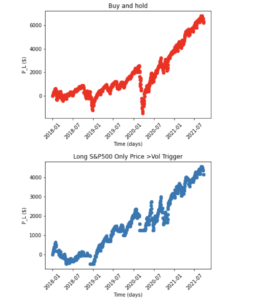
Vol Trigger Study

Two P/L charts from 2018 to 2021 show red buy and hold and blue long S&P500 only if price exceeds vol trigger.

Written by SpotGamma · Categorized: Market Analysis

Oct 19 2021

Trade Analysis: ES Futures (12 October 2021)
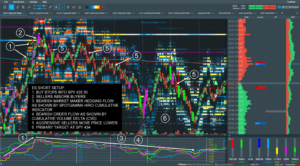
ES Short Setup HIRO Indicator SpotGamma

The following is a guest post from Doug Pless. As I have discussed in previous articles, I begin my morning preparation by reading the SpotGamma AM Founder’s Note when I plan to trade futures. For ES futures, I note gamma levels, the SpotGamma Imp. 1 Day Move, the SpotGamma Gamma Index, and Gamma Notional for […]

Written by developer · Categorized: Guest Post, Market Analysis · Tagged: Doug Pless, ES futures, HIRO Indicator, volatility

Oct 12 2021

YouTube Live: 10/12/21 2PM ET Notes

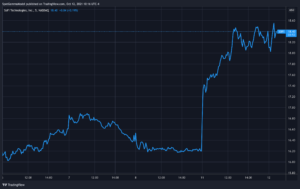
TradingView line chart of SOFI stock price from Oct 6-12, 2021, last at 18.40 after a sharp rise.

Join us today at 2pm ET as Brent from SpotGamma talks with Imran from Options-Insight. SOFI Gamma Squeeze HIRO: Hedging Impact of Real Time Options BITCOIN Energy EXTRA CREDIT – AMC REALIZED VS IMPLIED

Written by SpotGamma · Categorized: Market Analysis

Oct 12 2021

Trade Analysis: ES Futures (6 October 2021)
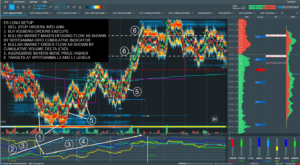
ES Long Setup Trade Analysis SpotGamma

The following is a guest post from Doug Pless. As I have discussed in previous articles, I begin my morning preparation by reading the AM Founder’s Note when I plan to trade futures. For ES futures, I note gamma levels, the SpotGamma Imp. 1 Day Move, the SpotGamma Gamma Index, and Gamma Notional for SPX […]

Written by developer · Categorized: Guest Post, Market Analysis · Tagged: Doug Pless, ES futures, HIRO Indicator

Oct 08 2021

Earnings Uncertainty Could Cause a Market Meltdown
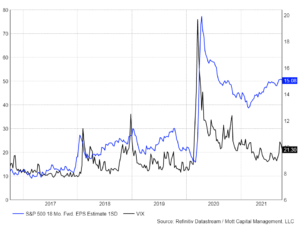
Rising Uncertainty Leads to Market Crash?

The following is a guest post courtesy of Michael Kramer of Mott Capital Management.  As uncertainty ticks higher in markets, volatility tends to follow. There is a tremendous amount of doubt building in the equity markets, especially regarding corporate earnings. With the market on the cusp of earnings season, volatility may see a massive spike.  […]

Written by developer · Categorized: Guest Post, Market Analysis · Tagged: market crash, Michael Kramer, VIX, volatility

Oct 05 2021

Trade Analysis: NQ Futures – 1 October 2021
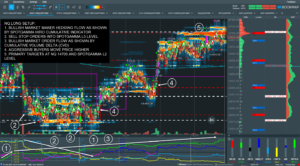
NQ Long Setup HIRO Indicator Doug Pless SpotGamma Chart

The following is a guest post from Doug Pless. As I have discussed in previous articles, I begin my morning preparation by reading the SpotGamma AM Report when I plan to trade futures. For ES futures, I note gamma levels and key metrics for SPX and SPY. For NQ futures, I note Gamma Notional, and […]

Written by developer · Categorized: Guest Post, Market Analysis · Tagged: Doug Pless, HIRO Indicator, NQ Futures

Oct 02 2021

Negative Gamma & Volatility

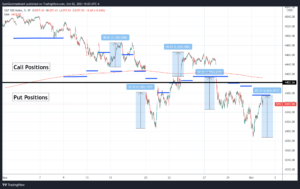
5-minute S&P 500 candlestick chart showing Call and Put Positions, 4402 line and blue range bars from Sept-Oct 2021.

September has a few spurts of volatility, particularly around 9/20/21 September options expiration, and the 9/22 FOMC. One of the primary metrics we produce for traders is our “volatility trigger”, which defines where we believe options dealers position flips from a positive gamma position, to a negative gamma position. We’ve plotted out this level in […]

Written by SpotGamma · Categorized: Market Analysis

Oct 01 2021

SpotGamma Report for: 10/01/2021 AM

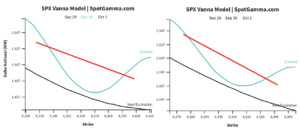
Two line charts titled SPX Vanna Model showing delta notional versus strike for Current and Next Expiration.

Daily Note: Large swings in futures overnight. Overnight lows were 4260 before ripping higher to 4315. As such we’ve rerun our models to reflect current ES levels. Regardless, as gamma is quite negative until SPX >4375 then there will be no stability in price. Key support is at 4302 with resistance at 4375, and 4400. […]

Written by SpotGamma · Categorized: Market Analysis

Sep 30 2021

SpotGamma Report for: 09/30/2021 AM

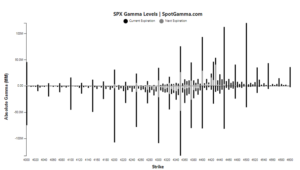
Bar chart of SPX gamma levels by strike from 4000 to 4600 showing current (black) and next (gray) expirations.

Daily Note: More choppy action in futures overnight which hit overnight highs of 4389 (~4400 SPX equivalent) before dropping back to last nights close of 4365. Due to it being the quarter end OPEX, we expect volatile action similar to yesterday.  4400 is major resistance, with 4361 support. There is a decent chunk of index/etf […]

Written by SpotGamma · Categorized: Market Analysis

  • « Go to Previous Page
  • Go to page 1
  • Interim pages omitted …
  • Go to page 33
  • Go to page 34
  • Go to page 35
  • Go to page 36
  • Go to page 37
  • Interim pages omitted …
  • Go to page 69
  • Go to Next Page »

Primary Sidebar

SpotGamma-Subscriber-Signup-Banner

  • Right-Tail Risk On CNBC: The Larger Moves Have Come To The Upside
  • CYTK: A $390K Options Bet Targets November FDA Catalyst
  • Why Option Premiums Look Too Thin To Sell
  • CPI Meets Positive Gamma: The SPX Levels That Could Determine the Next Move
  • The OPEX Effect: Put Selling Is Still Doing The Work
  • youtube
  • x
  • Privacy Policy
  • Disclaimer
  • Terms & Conditions
  • Support Center
  • Media
  • Contact Us

©2026 TenTen Capital LLC DBA SpotGamma

All SpotGamma materials, information, and presentations are for educational purposes only and should not be considered specific investment advice nor recommendations. Futures, foreign currency and options trading contains substantial risk and is not for every investor. An investor could potentially lose all or more than the initial investment. Risk capital is money that can be lost without jeopardizing one's financial security or lifestyle. Only risk capital should be used for trading and only those with sufficient risk capital should consider trading. Past performance is not necessarily indicative of future results. Testimonials appearing on this website may not be representative of other clients or customers and is not a guarantee of future performance or success.

View Full Risk Disclosure