Market Makers & Coronavirus: The Mechanics of a Market Sell-Off How do sell-offs actually happen? With the S&P 500 selling off hard and fast, Hari Krishnan, fund manager at Doherty Advisors, breaks down the mechanics of market meltdowns. Krishnan explains the role of different institutional players like market-makers and drills down on the individual components […]
Market Analysis
The Large 3/20 Options Expiration
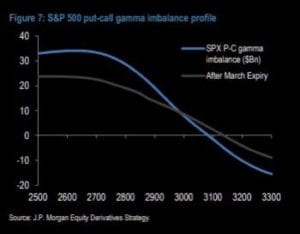
Options expiration for this Friday 3/20 is getting a lot of attention because it is so large. It may also hold the key to a major change in our “negative gamma” situation. As you can see markets remain in negative gamma territory unless we move up towards 3100-3150 in the SPX. The other way we […]
What Happens if Options Exchange Close?
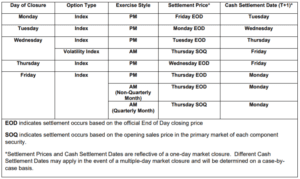
Global markets are a mess, and there seems to a be a distinct possibility that we see a market closure of some type before this calm. The NYSE and CBOE are closing their trading floors (where humans congregate) due to coronavirus but their electronic exchanges will remain open. Here is the quick summary if you […]
When Might this Volatility End?
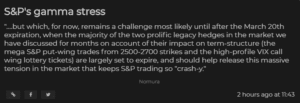
We have been targeting next weeks OPEX 3/20 as a key time in this “volatility cycle” as there is very large open interest. As that open interest is closed or rolled it may allow some calm as call options are re-struck closer to at-the-money and put options are rolled out and down. This could effectively […]
The Friday Option Position “Blowout”
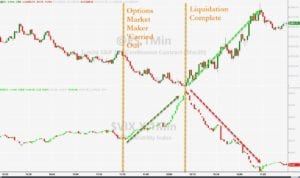
ZeroHedge posted an article Friday that caught a lot of attention. Basically they claim that a firm got a tap on the shoulder from the risk department and were forced to close out positions. This may also have been a Margin Call. If someone got tagged (allegedly) doesn’t really matter to us, what happened in […]
March ’20 Nomura Gamma
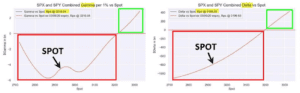
Great post from Heisenberg about Nomura and SocGen Gamma reports below. This chart went up on Thursday 3/5 – here is the SpotGamma gamma chart for reference: In “We’re All Momentum Traders Now”, I spent quite a bit of time attempting to drive home one overarching point: Directional moves over the past two weeks have […]
Poor Liquidity & Negative Gamma: Volatile Stuff
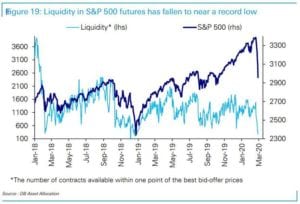
We’ve written extensively about negative gamma and poor liquidity during volatile markets, and wanted to post some of those effects in real time. ZH posted an article framing how bad liquidity in ES futures is, note the chart below: as the following chart from Deutsche Bank shows, overall liquidity for S&P500 futures has fallen to all […]
Nomuras View of Feb 2020 Crash
My view of the past week has been this: The markets slipped into negative gamma on Monday 2/24 under the narrative of Coronavirus fears. As large concentrations of puts went in the money their hedging requirements increased, meaning gamma got more negative as the market moved lower. Once in negative gamma territory options dealers change […]
Searching for a Market Bounce: Feb 2020
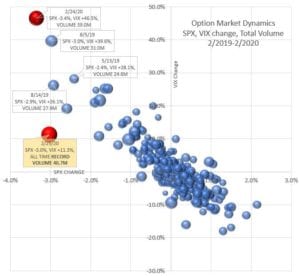
Below are a few charts that we’ve been watching as we’re in the midst of the Crash of Feb 2020. Several indicators are showing extreme readings and we wanted to chronicle those. If you have one you think we should add email us: sg@spotgamma.com. One of the things we look at “Gamma Tilt” which is […]
February 2020 Selloff & Gamma Trap
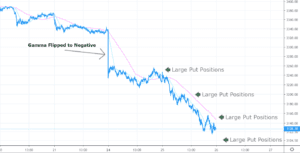
There has been relentless selling during the end of February attributed to Coronavirus fears. There are clearly sellers of all types active in the current market, but much of this selling may be attributed to negative market gamma and the “gamma trap”. As you can see below on over the weekend of Feb 24th futures […]