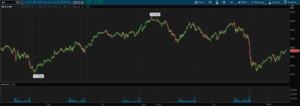
Yesterday markets fell apart pretty quickly and that leads us to highlight ES volume and the poor liquidity seen. You can see in the chart below that ES volume was higher than its recently been and a lot of that was concentrated into the close. This leads us to an interesting point about ES Futures […]
Market Analysis
Nomura Pre May OPEX Update
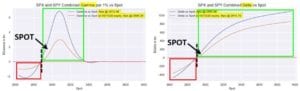
Like we have been highlighting to subscribers this weeks May SPX options expiration (OPEX) (Friday AM) could bring a state change to markets. From ZH we find another note from Nomura, echoing our sentiment: Into this week’s options expiry, Spooz (ref 2927) continue to remain pretty-sticky between 3 of the 4 largest $Gamma strikes on […]
SPX Options Levels & ES Futures Trading
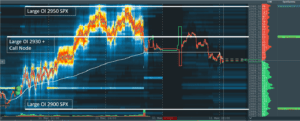
We believe that strikes with high open interest in the SPX create support and resistance lines for ES Futures trading. Here is one prime example. At top is the morning note we sent to subscribers at at the bottom you see those levels noted in the Bookmap futures trading platform. Futures currently trade at a […]
Morgan Stanley VIX & SPX Market Gamma Update
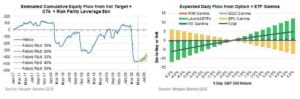
From Zerohedge we see some nice Gamma related research from Morgan Stanley. Posted below is their note. By Chris Metli of Morgan Stanley Quantitative Derivative Solutions The March 2020 equity selloff ushered a huge volatility shock that caused unprecedented losses for short volatility strategies. The impact is likely bigger than just a one-time hit to […]
Nomura Market Gamma Update 5/6/20
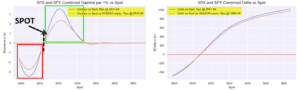
Like we wrote on Twitter and to subscribers a few days ago, the market is stuck in Gamma Neutral and Nomura agrees. Like our data, Nomura went from ~2940- ~2850. Exact flip points keep flopping. <2800 is trouble | >2900 we can all chase the top | 2800-2900 ¯\_(ツ)_/¯ pic.twitter.com/VvwkBETfms — spotgamma (@spotgamma) May 4, […]
Nomura Draws the Market Gamma Line
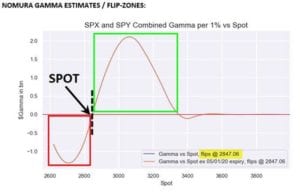
We produced these levels in real time for subscribers, but if you’re a bit behind here is the update from Nomura via ZH. This note comes after the SPX tested 2950, and sold off toward the 2800 level on Friday 5/1/20. The gap also shocked the also just-established Dealer “Long Gamma” position (when ref was […]
Nomura Gamma Update 5/1/20
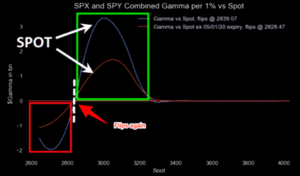
From MarketEar: What about those CTAs and gamma dealers here? Yesterday people were quoting Nomura’s quant and his take on positioning: “…now increasingly outright ‘long gamma’…less spastic market moves” Per our post yesterday “Where is that long gamma today…” we pointed out; “Watch the downside should they “flip” to short gamma again….back to magnifying the […]
Is Nomura Reading SpotGamma Notes?

No, I’m sure they arent. But there are a lot of overlap. From our recent subscriber notes: 2950 should now set up as the High Gamma strike resistance with 2900 the first line of support. As we are in positive gamma territory we see decreased risk of a sharp sustained drop from this level – […]
Pre Fed Dealer Gamma Charts
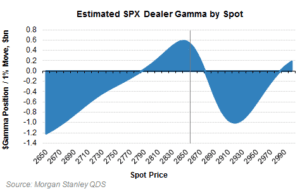
We note to subscribers today that the market is at a key “gamma crossroads” around 2900 where we see sustained positive gamma above that level and the possibility of a strong move into negative gamma if the Fed disappoints today. For the past week we have been consolidating around the zero gamma level and options […]
Options Gamma Levels and Futures Movement
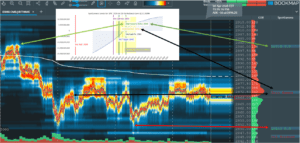
Today was an interesting day to highlight how our SPX Index options gamma levels can come into play for futures trading. Coming into today the market had experienced a sharp rally, and futures were set to open over 2900. Below you see a snapshot of ES futures in Bookmap, and our morning gamma chart (sent […]