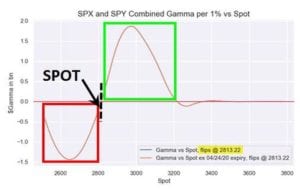
Zerohedge gives us Nomuras gamma estimate for 4/24/20 with an estimate gamma flip point of around 2800 in the SPX. Note this is a COMBINED SPY/SPX estimate. As Nomura’s Charlie McElligott notes, the S&P 2,800 has emerged as the “Neutral Gamma” zone for the market “and again, is likely to remain that way, as the […]
Market Analysis
Example Gamma Level Trade in SPY
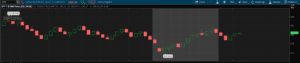
Today we want to provide an example of how we use the gamma data to setup a trade. Here we are using the SPX options data but using SPY to express our viewpoint that the SPX will stick to the 2800 area today. Note: This is a very basic trade and meant to convey general […]
Can Options Expiration Turn 2/3?
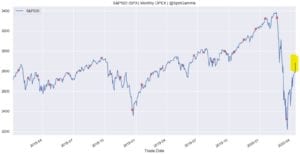
We wrote about why we think SPX Options Expiration can create volatility before (see here) and wanted to post the chart below which shows just how impactful the large monthly SPX options expiration has been the last 2 months. You can see in the chart below the February expiration was within 2 days of the […]
The Options Magnet

We theorize that strikes with a high amount of options gamma combined with high options volume at that strike(s) can influence the SPX to that level. This something similar to an options “pin” but we think of it more as a “magnet”. You can see in the chart below that the 2800 strike has a […]
The Option Pin / Sticky Strike
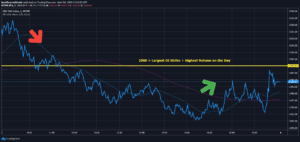
Friday (4/3/20) was an interesting day in the S&P500 market due to its rotating action around the 2500 strike. We had several data points that led us to believe that this strike would be key to the action on Friday and wanted to highlight those points. Most of these charts are only available to subscribers […]
Still Question the Impact of Options?
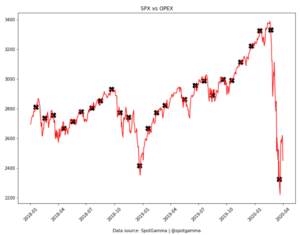
This past March monthly OPEX was one of the largest on record, and featured very large deep in the money put positions. We believed this was a key driver of market volatility in early March, and the change in markets following expiration has been drastic. March OPEX was on 3/20, and it was the following […]
Zero Gamma = Zero Gravity
We posted a few days ago about the “right” tail risk and the possibility of a market rally. In a note to subscribers we added to this, suggesting the market may be in an airpocket. Specifically: “zero gravity”. Most of you are probably familiar with those flights which take you to the edge of space […]
Corona Market: Reviewing Right Tail Risk
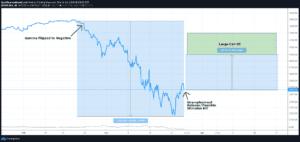
This is being written just before the 3/26 unemployment data release which is forecasting as much as 2 million unemployment due to the economic shutdown related to Coronavirus. There is also a Stimulus Bill “pending“. While we are all aware of the downside risks here, here is a scenario for a major move to the […]
The Case for Reduced Price Volatility
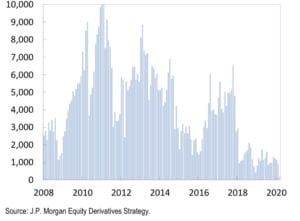
Our current view of markets is that we should see reduced price volatility following the large March expiration that took place this past Friday (3/20). One of the features of this expiration was a large number of in the money puts, which possibly created several billion in deltas for options dealers to hedge. As dealers […]
Nomuras Pre-OPEX Market View
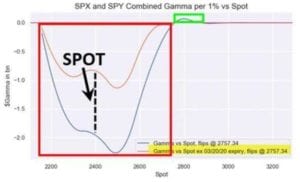
We wrote a few days ago about the importance of tomorrows 3/20 options expiration because of 1) its sheer size and 2) its amount of deep in the money puts. ZeroHedge adds to this sentiment with some notes from Nomuras McElligott: this “large decline in the gamma post-expiration” should allow markets to pivot back to […]