
### You must be logged in to access this content. Don’t have an account with SpotGamma? Sign up today to view unique key levels, Founder’s Notes, market commentary, options analysis tools, and expert insights. If you’re already a SpotGamma subscriber, log in here: Username or E-mail Password Remember Me Forgot Password
Understanding Zero DTE Single Stock Options and Market Volatility Dynamics Amid Geopolitical Risks
The Options Market Trapdoor
Over the past week, the topic of volatility has returned to the forefront. While the market has been largely range-bound, underlying support remains tenuous. Simultaneously, traders have begun more actively paying for downside protection. Given the backdrop of flaring geopolitical conflict, we see assymetric downside risk forming as trader uncertainty and negative gamma threaten to unlock the […]
Navigating Market Volatility and Options Strategies with SpotGamma Insights
### You must be logged in to access this content. Don’t have an account with SpotGamma? Sign up today to view unique key levels, Founder’s Notes, market commentary, options analysis tools, and expert insights. If you’re already a SpotGamma subscriber, log in here:
VVIX Explained: What the Volatility Index Tells Traders

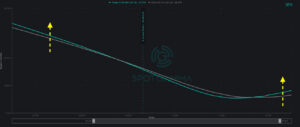
The VVIX measures the expected volatility of the VIX itself — giving options traders a window into hedging demand, dealer positioning, and what the market is pricing before volatility materializes. SpotGamma’s forward return data shows
what elevated VVIX levels have historically meant for SPY and VIX.
Earnings Options Trades With SpotGamma
A strategic way to look at options trades into earnings, using SpotGamma’s institutional trading tools.
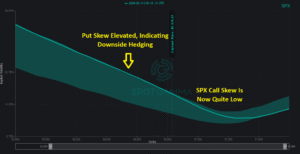
Right Tail Risk Is Building in the S&P 500
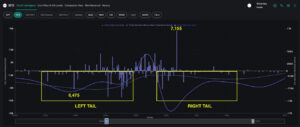
The market spent most of last week locked in the SPX 6,800–6,900 range that has largely held since Thanksgiving. Wednesday’s VIX expiration and Friday’s monthly OPEX defined the week’s rhythm, while negative gamma positioning and elevated single-stock put demand maintained pressure under the surface. Our historical OPEX data suggests the market is positioned for a […]
Why the Market Keeps Bouncing Despite Negative Gamma and What Retail Put Selling Reveals About Current Market Dynamics
### You must be logged in to access this content. Don’t have an account with SpotGamma? Sign up today to view unique key levels, Founder’s Notes, market commentary, options analysis tools, and expert insights. If you’re already a SpotGamma subscriber, log in here:
Navigating February OPEX: Fixed Expiration Day: Key Market Levels, Volatility Dynamics, and Single Stock Opportunities for Traders

### You must be logged in to access this content. Don’t have an account with SpotGamma? Sign up today to view unique key levels, Founder’s Notes, market commentary, options analysis tools, and expert insights. If you’re already a SpotGamma subscriber, log in here:
Flat Index Masks Hidden Chaos
Overall price stability in the S&P 500 is masking one of the most unusual equity environments in recent years. While SPX has been roughly flat over the past month, the average constituent has moved 10.8% — a 99th percentile dispersion reading, as we discussed in our Thursday AM Founder’s Note. All signs point to increasing fragmentation beneath […]
SpotGamma Market Flow Analysis Reveals Algo-Driven Selloff and Potential Bounce at Key S&P Levels
### You must be logged in to access this content. Don’t have an account with SpotGamma? Sign up today to view unique key levels, Founder’s Notes, market commentary, options analysis tools, and expert insights. If you’re already a SpotGamma subscriber, log in here: