• Skip to main content
  • Skip to primary sidebar

SpotGamma™

S&P 500 Stock Market Gamma Trading Levels Based on Options Open Interest

  • About
  • Pricing
  • Academy
  • Resources
    • Tool Demos
    • Case Studies
    • Blog
    • Support Center
    • Daily Report
    • Free Trading Tools
      • Opening Setup Free Report
      • Options Profit Calculator
      • SPX Gamma Exposure
      • Implied Earnings Moves
    • Report Card
  • Login

NVDA

Jun 06 2024

Office Hours with Imran: Key Strategies for Navigating Volatility, Black-Scholes Calculations & Volatility Skew Insights

### You must be logged in to access this content. Don’t have an account with SpotGamma? Sign up today to view unique key levels, Founder’s Notes, market commentary, options analysis tools, and expert insights. If you’re already a SpotGamma subscriber, log in here: Username or E-mail Password Remember Me     Forgot Password

Written by SpotGamma · Categorized: Q&A · Tagged: Black Scholes, GME, NVDA, Volatility Skew

May 14 2024

Unpacking May OPEX: How Will Low Volatility and NVDA Earnings Shape The S&P 500?
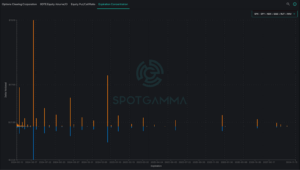
Expiration concentration bar chart of delta notional from 2024 to 2027 featuring orange and blue bars of varying heights.

Key Points: A Brief Synopsis: Large call positions are driving low volatility into May options expiration. The expiration of call positions lines up with several key data points (Fed Speaking, CPI) which may cause volatility to briefly expand into the end of this week (Friday, 5/17), and into VIX expiration & NVDA earnings on 5/22. […]

Written by SpotGamma · Categorized: Market Analysis · Tagged: NVDA, OPEX

Mar 14 2024

How SpotGamma Identified NVDA’s 900 Reversal — And Mapped the Entire Move Lower
Doug-Pless-SpotGamma-NVDA-Reversal-Trade-March-2024

This NVDA case study shows how a single level — the 900 Call Wall — set the stage for a high-probability intraday reversal, with SpotGamma tools mapping the move from resistance all the way down to key support levels. By combining positional analysis with real-time flow signals from HIRO, traders could anticipate both the breakdown […]

Written by SpotGamma · Categorized: Market Analysis · Tagged: Case Study, Doug Pless, NVDA

Jul 26 2022

Trade Analysis: NVDA (July 20, 2022)

NVDA long setup SpotGamma HIRO Indicator Bookmap chart

The following is a guest post from Doug Pless. When I plan to trade stocks for the day, I begin my morning preparation by opening my watchlist in Equity Hub. I look at the Key Gamma Strike, Hedge Wall, Key Delta Strike, and other metrics for each stock and compare the values with the previous […]

Written by SpotGamma · Categorized: Guest Post, Market Analysis · Tagged: Doug Pless, Equity Hub, HIRO Indicator, NVDA

Apr 26 2022

Trading Stock Using Equity Hub and HIRO
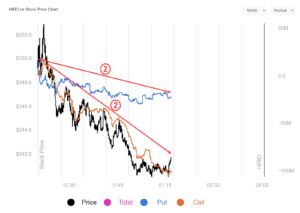
NVDA short setup HIRO Indicator

The following is a guest post from Doug Pless. When I plan to trade stocks for the day, I begin my morning preparation by opening my watchlist in Equity Hub. I look at the Key Gamma Strike, Hedge Wall, and other metrics and compare the values with the previous values for the last five days. […]

Written by SpotGamma · Categorized: Guest Post, Market Analysis · Tagged: Doug Pless, Equity Hub, HIRO Indicator, NVDA

Mar 29 2022

Trading Stocks With SpotGamma and Bookmap HIRO
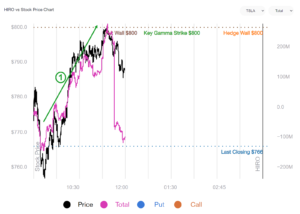
trading tsla hiro indicator doug pless

The following is a guest post from Doug Pless. When I plan to trade stocks for the day, I begin my morning preparation by opening my watchlist in Equity Hub. I look at the Key Gamma Strike, Hedge Wall, and other metrics and compare the values with the previous values for the last five days. […]

Written by SpotGamma · Categorized: Guest Post, Market Analysis · Tagged: AMD, Doug Pless, HIRO, HIRO Indicator, NVDA, TSLA

Mar 21 2022

There Are Times When Nothing Is Happening
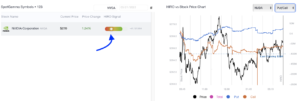
HIRO Indicator NVDA no options action

The goal of HIRO is to alert users as to when options order flow may be impacting a stocks price. Equally important is knowing when options are not involved! A member asked us today about NVDA’s flow, and our response was “there’s nothing going on!”. This can be seen by the fact that the HIRO […]

Written by SpotGamma · Categorized: HIRO, Market Analysis · Tagged: NVDA

  • « Go to Previous Page
  • Go to page 1
  • Go to page 2

Primary Sidebar

SpotGamma-Subscriber-Signup-Banner

  • Tech Vol Collapsed, Put Skew Held Rich: Options Action Live on CNBC
  • Gamma Guy: The 0DTE Flow That Usually Pins the Index Didn’t Arrive
  • AMD Earnings Preview: Can AI Growth Overcome Rising Volatility and Expectations?
  • Relatively Few Traders Are Positioned For The Right Tail
  • Palantir (PLTR) Earnings Preview: Can AI Growth Justify Another Explosive Move?
  • youtube
  • x
  • Privacy Policy
  • Disclaimer
  • Terms & Conditions
  • Support Center
  • Media
  • Contact Us

©2026 TenTen Capital LLC DBA SpotGamma

All SpotGamma materials, information, and presentations are for educational purposes only and should not be considered specific investment advice nor recommendations. Futures, foreign currency and options trading contains substantial risk and is not for every investor. An investor could potentially lose all or more than the initial investment. Risk capital is money that can be lost without jeopardizing one's financial security or lifestyle. Only risk capital should be used for trading and only those with sufficient risk capital should consider trading. Past performance is not necessarily indicative of future results. Testimonials appearing on this website may not be representative of other clients or customers and is not a guarantee of future performance or success.

View Full Risk Disclosure