The market delivered several volatile sessions last week as traders navigated Wednesday’s CPI inflation report, Friday’s massive SpaceX IPO (SPCX), and a mix of Iran-driven headlines throughout.
Last Sunday, we wrote about how extreme options positioning into major catalysts could spark the exact volatile market behavior observed over the past several days. Tuesday’s wild 200-point intraday swing set the mood for the week, which continued into Wednesday with a 1.6% open-to-close drop. The market then adopted a bullish tone Thursday and Friday, driven by conflict deescalation and enthusiasm surrounding SpaceX.
Behind the scenes, we now see another important story unfolding: market maker positioning has entered a transitional state. Neutral-to-negative gamma from 0DTE trading now blankets the local price range, meaning dealer hedging no longer acts as a stabilizing market force.
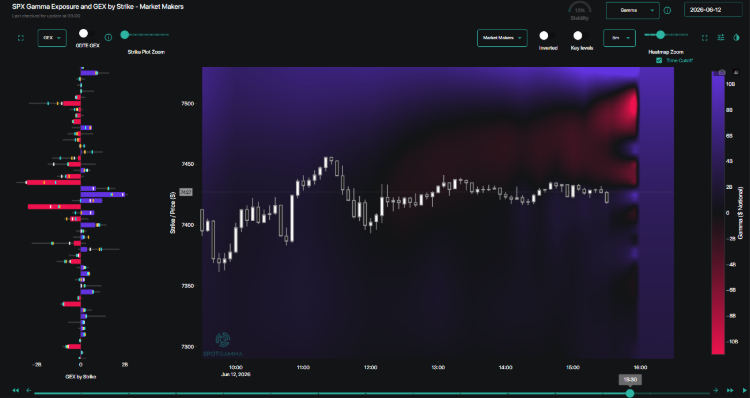
The decline of positive dealer gamma comes as a result of 0DTE trading, as traders once again began speculating through short-dated options buying. When dealers hold negative gamma, they hedge by trading with the direction of the market — selling into weakness and buying into strength. This hedging activity amplifies price movement in either direction.
Next week brings FOMC alongside a Triple Witching options expiration. This combination within a compressed 4-day trading week sets the stage for another round of outsized moves.
Call Buying Picks Up: Positioning and Volatility Reset
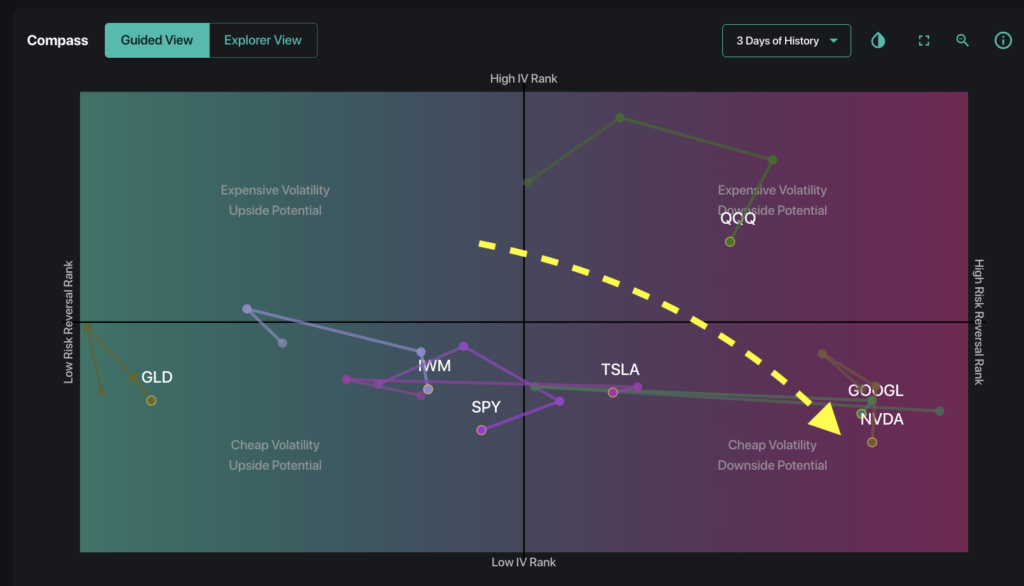
Starting Thursday, call demand began to aggressively pick up. Our Compass grid shows many stocks moving to the right — indicating decreasing downside hedging, and growing upside participation.
Such a strong shift in a short timeframe underscores how quickly conviction can change when macro anxieties ease.
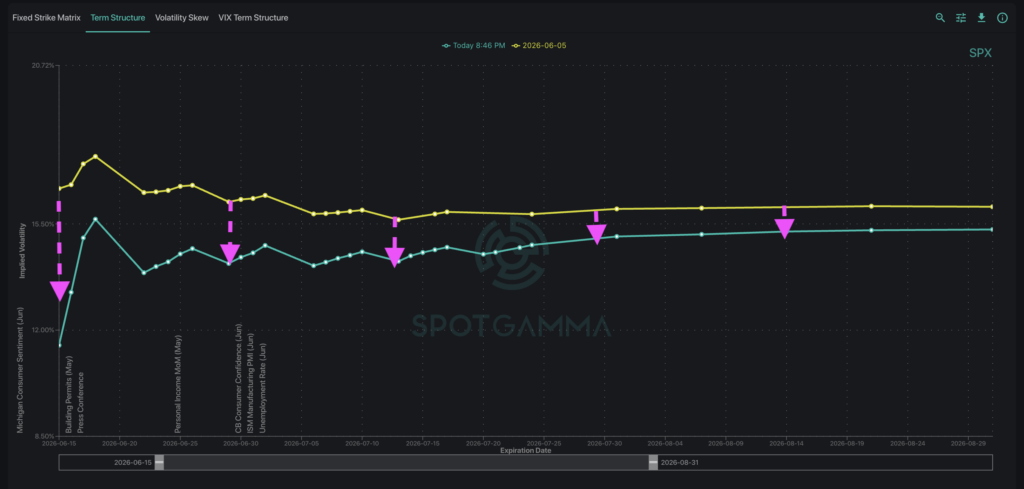
This repositioning has also worked its way through to the volatility surface. As shown below, SPX implied volatility this week reset lower compared to last Friday across the term structure. This shows an unwind in the fear premium that had built up in the past week.
The question now is whether that calm can hold, as the week ahead contains two of the most consequential events on the calendar: the FOMC decision (June 17) and June Triple Witching OPEX (June 18).
This Wednesday will be the first FOMC meeting with Kevin Warsh serving as Fed Chair, which could introduce a new policy tone for markets. At the same time, quarterly options expiration will remove a significant amount of positioning as index, equity, and futures options settle simultaneously.
With gamma still negative and volatility only just beginning to compress, the market has little cushion if either event generates more volatility than currently expected.
Has Gold Lost Its Luster?
Gold now shows one of the most interesting setups heading into next week. The precious metal has declined ~27% from all-time high reached in January this year. Recent weakness may reflect rising rate expectations, as higher yields tend to reduce the relative attractiveness of gold.
The gold-tracking ETF GLD appears to have found support near the 360 Put Wall level, which roughly aligns with spot gold near the $4,000 area. GLD currently carries a Skew Rank of 6% and an IV Rank of 38%, indicating relatively bearish options positioning alongside a moderate level of implied volatility.
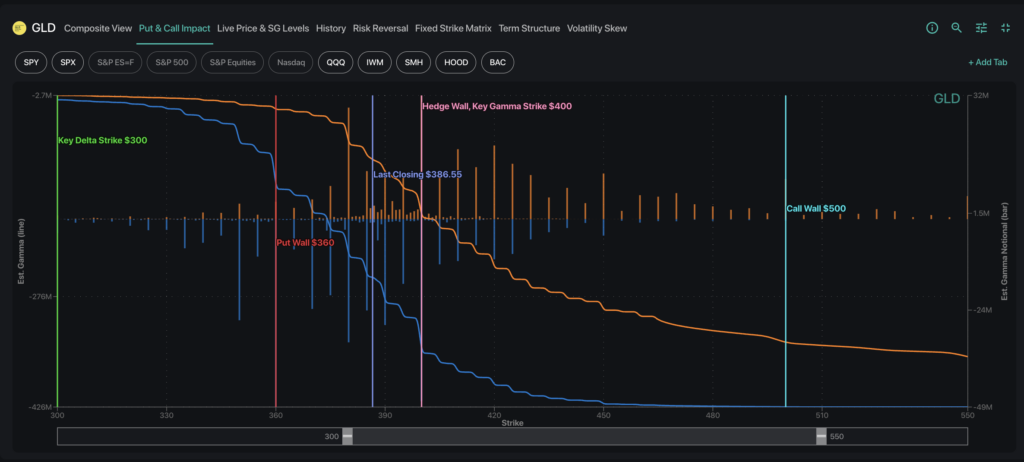
Because gold is particularly sensitive to interest-rate expectations, the market’s reaction to next week’s FOMC meeting will be worth watching. A more hawkish tone from the Fed could weigh gold down further to break past structural support, aligning with bearish positioning from traders. A dovish stance could signal that any rate cuts are likely to remain on hold, providing further support for gold.