• Skip to main content
  • Skip to primary sidebar

SpotGamma™

S&P 500 Stock Market Gamma Trading Levels Based on Options Open Interest

  • About
  • Pricing
  • Academy
  • Resources
    • Tool Demos
    • Case Studies
    • Blog
    • Support Center
    • Daily Report
    • Free Trading Tools
      • Opening Setup Free Report
      • Options Profit Calculator
      • SPX Gamma Exposure
      • Implied Earnings Moves
    • Free Training
    • Report Card
  • Login

Market Analysis

Jul 19 2021

Playing Friday’s Move Lower in ES Futures

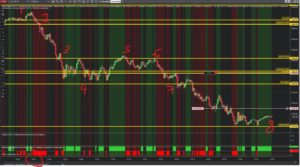
2-minute ES futures candlestick chart with yellow price levels and red numbered annotations from 1 to 8.

This is a guest post from professional trader David Blake. Friday saw a decent down day for a change and all being well we’ll see more like this in the weeks ahead. I wanted to share how useful again the spotgamma unicorn levels were to me on trades during Friday RTH allowing me to trade […]

Written by SpotGamma · Categorized: Guest Post, Market Analysis · Tagged: bookmap, David Blake, ES, NinjaTrader

Jul 14 2021

The Unclenching Of Gamma May Unleash The Overbought Stock Market
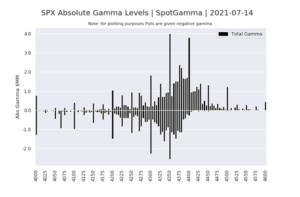
Bar chart of SPX absolute gamma by strike from 4000 to 4600 on 2021-07-14, puts shown as negative.

The following post is courtesy of Michael Kramer of Mott Capital Management. Reach him on Twitter. Since the big June options expiration, US equity markets have run sharply higher. Starting on June 18, the S&P 500 has gained an unexpected 5%. The move higher has come despite many economic reports suggesting the economy may have […]

Written by developer · Categorized: Guest Post, Market Analysis · Tagged: gamma, Michael Kramer

Jul 14 2021

Implied Volatility Reading in the SPX & VIX

Brent Kochuba, Founder of SpotGamma, joins Imran Lakha of Options-Insights to talk about the current volatility readings in the SPX and VIX. This covers both realized and implied volatility which are shifting ahead of a large options expiration.

Written by developer · Categorized: Market Analysis · Tagged: implied volatility, realized volatility, VIX

Jul 14 2021

AMC & The $40 Strike

There is a ton of gamma expiring on Friday for AMC which is heavily tied to the $40 options strike. Here we discuss this dynamic with the stock trading lower at $37.

Written by developer · Categorized: Market Analysis, Stock · Tagged: AMC

Jul 13 2021

Trader Doug Pless: Use Real Time Options Flow To Confirm Your Thesis
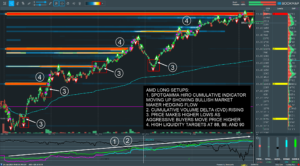
Bookmap chart of AMD with numbered higher lows, rising HIRO and CVD, liquidity at 88, 89, 90.

Doug is a full time trader from the US focusing on futures and equities. Reached him on twitter! As we have discussed previously, many traders open bullish option positions early in the week with short-term options that expire at the end of week. As traders buy calls and sell puts, market makers take the opposite […]

Written by developer · Categorized: Guest Post, Market Analysis · Tagged: AMD, Doug Pless, SPCE

Jul 13 2021

Trader David Blake & ES “Unicorn Levels”
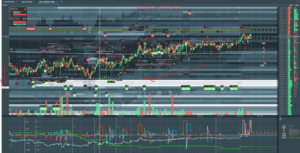
Candlestick chart with volume bars, overlays, and red arrows highlighting a white horizontal band.

This post is courtesy of David Blake, a full time trader from the UK. He can be reached on Twitter. I always have loved the London open and that harks back to my forex trading days. ETH (extended trading hours) often has a simpler rhythm to it, keep an eye of what the European markets […]

Written by developer · Categorized: Guest Post · Tagged: David Blake, ES futures

Jul 13 2021

SpotGamma Report for: 07/13/2021 AM

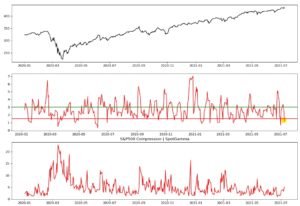
Three stacked line charts from Jan 2020 to Jul 2021: black top line, middle red S&P500 Compression, and red bottom line.

Daily Note: Futures are flat overnight holding 4377. We see little change in gamma levels, with 4350-4400 the main range into Fridays OPEX. With that our model forecasts a very small max move today of 76bps/33pts. 4384 shows as a very large Combo Strike which may be a decent “fair value”/pivot reference for today. As […]

Written by developer · Categorized: Market Analysis

Jul 07 2021

S&P500 Is Less Volatile Into Expiration
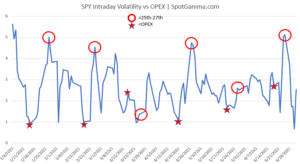
S&P 500 Less Volatile Going Into Expiration

In our daily subscriber reports we often talk about the “Options Expiration [OPEX] Cycle” and its influence on the S&P500. This cycle starts on the third Friday of each month, wherein its typical to have >20% of total S&P500 options* expiring. Our view is that options market maker hedging begins to concentrate around the strikes […]

Written by developer · Categorized: Market Analysis · Tagged: OPEX, volatility

Jul 07 2021

AMZN Topping Out?

amzn-overextended-at-3700-spotgamma

This morning we highlighted that positive news and a huge number of call options traded likely gamma squeezed AMZN up over $3700. However our EquityHub data showed that most of the gamma in Amazon was tied to the $3600 strike which indicates that at $3700 (opening prices on 7/7) the stock is likely overextended.

Written by developer · Categorized: Market Analysis, Stock · Tagged: AMZN, gamma squeeze

Jun 27 2021

New Highs Brings Out the Options Sellers
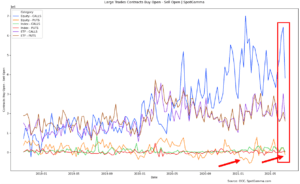
new highs bring out options sellers

SpotGamma collects raw data which sheds light on the previous weeks options transactions. This past weeks data was quite interesting in light of several of the developments which took place last week. Below we’ve taken the total number of contracts bought to open, netted against contracts sold to open. Here we are only showing large […]

Written by developer · Categorized: Market Analysis · Tagged: OCC, put selling, volatiltiy

  • « Go to Previous Page
  • Go to page 1
  • Interim pages omitted …
  • Go to page 37
  • Go to page 38
  • Go to page 39
  • Go to page 40
  • Go to page 41
  • Interim pages omitted …
  • Go to page 69
  • Go to Next Page »

Primary Sidebar

SpotGamma-Subscriber-Signup-Banner

  • Right-Tail Risk On CNBC: The Larger Moves Have Come To The Upside
  • CYTK: A $390K Options Bet Targets November FDA Catalyst
  • Why Option Premiums Look Too Thin To Sell
  • CPI Meets Positive Gamma: The SPX Levels That Could Determine the Next Move
  • The OPEX Effect: Put Selling Is Still Doing The Work
  • youtube
  • x
  • Privacy Policy
  • Disclaimer
  • Terms & Conditions
  • Support Center
  • Media
  • Contact Us

©2026 TenTen Capital LLC DBA SpotGamma

All SpotGamma materials, information, and presentations are for educational purposes only and should not be considered specific investment advice nor recommendations. Futures, foreign currency and options trading contains substantial risk and is not for every investor. An investor could potentially lose all or more than the initial investment. Risk capital is money that can be lost without jeopardizing one's financial security or lifestyle. Only risk capital should be used for trading and only those with sufficient risk capital should consider trading. Past performance is not necessarily indicative of future results. Testimonials appearing on this website may not be representative of other clients or customers and is not a guarantee of future performance or success.

View Full Risk Disclosure