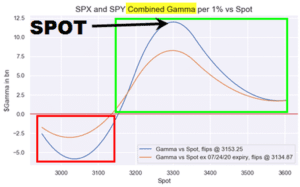
From ZH: Indeed, according to Nomura quant Charlie McElligott, after last month’s near-record Op-Ex, things are far more calm now and “3300 looks like the truth in Spooz, with nearly double the aggregate $Gamma ($4.5B) of the next closest line (3250 with $2.4B) as we head into expiry, thus exhibiting some “gravity” with Spooz up nearly 90 […]
gamma
TSLA Options Pre Earnings
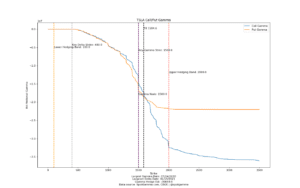
TSLA reports earnings tonight, and there is a ton of options gamma to generate a large move tomorrow. We define key levels for the stock as follows: Lots of Gamma at 1500 – thats the “pivot” area where stock remains a bull above, bear below. There are a ton of in the money calls at […]
Goldman: All You Ever Wanted To Know About Gamma, Op-Ex, And Option-Driven Equity Flows

From ZeroHedge: In our daily observations of (bizarre) market moves (usually in the context of comments from Nomura’s Charlie McElligott and Masanari Takada), we frequently analyze the delta-hedging of option positions by dealers, i.e. gamma, which for a variety of reasons has emerged as one of the dominant drivers of risk assets (at least until […]
Equity Call Euphoria & OPEX Concentration
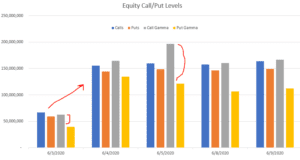
We have been reviewing the last 5 days of options data in light of reports showing record levels of call positions. Seen below you can see that call volumes have exceeded those of February 2020 – something we felt helped lead to the large drop in March. As you can see below our data suggests […]
The MGM Call Spectacular
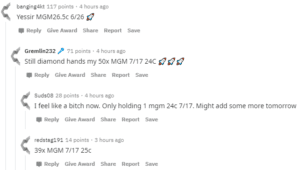
Intrigued by the record amount of call buying we decided to take a look at options in one of the more speculative names: MGM. There wasnt much of a scientific process to select a name, we just jumped to Reddit /wallstreetbets and chose the first name they were excited about. It seems like these folks […]
Nomuras Pre-OPEX Market View
We wrote a few days ago about the importance of tomorrows 3/20 options expiration because of 1) its sheer size and 2) its amount of deep in the money puts. ZeroHedge adds to this sentiment with some notes from Nomuras McElligott: this “large decline in the gamma post-expiration” should allow markets to pivot back to […]
RealVision: Excellent Gamma Discussion
Market Makers & Coronavirus: The Mechanics of a Market Sell-Off How do sell-offs actually happen? With the S&P 500 selling off hard and fast, Hari Krishnan, fund manager at Doherty Advisors, breaks down the mechanics of market meltdowns. Krishnan explains the role of different institutional players like market-makers and drills down on the individual components […]
Nomuras View of Feb 2020 Crash
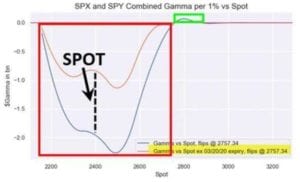
My view of the past week has been this: The markets slipped into negative gamma on Monday 2/24 under the narrative of Coronavirus fears. As large concentrations of puts went in the money their hedging requirements increased, meaning gamma got more negative as the market moved lower. Once in negative gamma territory options dealers change […]
Nomura Gamma Report 1/7/20
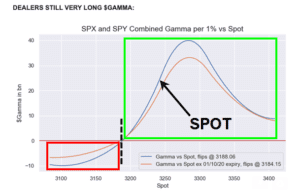
Here is an updated Nomura gamma snapshot to compare vs ours. Note we both have gamma flip at ~3185 with peak gamma around 3275. He also sees 3250 as a “pin” much as we’ve shown in subscriber reports. Thanks to Heisenberg report. “And the same song remains—SPX Dealer ‘Gamma flip’ level is meaningfully below market”, […]
BusinessInsider.com Talks Gamma
A good primer on market gamma from BI: So why do markets move at all if gamma is, like in this example, the big decelerator? Because it depends who owns it. Market makers use their gamma because they must. There is nothing worse than sitting on a position and bleeding white over time as your […]