• Skip to main content
  • Skip to primary sidebar

SpotGamma™

S&P 500 Stock Market Gamma Trading Levels Based on Options Open Interest

  • About
  • Pricing
  • Academy
  • Resources
    • Tool Demos
    • Case Studies
    • Blog
    • Support Center
    • Free Daily Report
    • Free Trading Tools
      • Options Profit Calculator
      • SPX Gamma Exposure
      • Implied Earnings Moves
      • Volatility Ranking
    • Free Training
    • Report Card
  • Login

gamma

Jul 14 2021

The Unclenching Of Gamma May Unleash The Overbought Stock Market
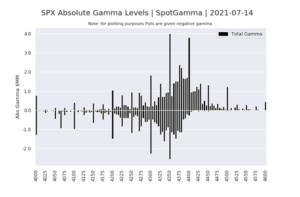
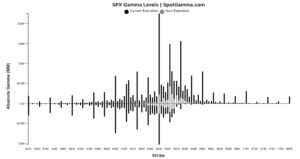
Bar chart of SPX absolute gamma by strike from 4000 to 4600 on 2021-07-14, puts shown as negative.

The following post is courtesy of Michael Kramer of Mott Capital Management. Reach him on Twitter. Since the big June options expiration, US equity markets have run sharply higher. Starting on June 18, the S&P 500 has gained an unexpected 5%. The move higher has come despite many economic reports suggesting the economy may have […]

Written by developer · Categorized: Guest Post, Market Analysis · Tagged: gamma, Michael Kramer

Apr 28 2021

“Banging Between Big Strikes” – Levels To Watch Ahead Of FOMC Statement

FOMC-options-levels-spotgamma

BY TYLER DURDENWEDNESDAY, APR 28, 2021 – 01:25 PM As we detailed overnight, today’s FOMC is widely expected to be “steady as she goes” with Biden conveying that the FOMC is not yet thinking about shifting its dovish stance. The only “risk” associated with today could be a “semantics” acknowledgement of better data (though we note the […]

Written by developer · Categorized: Market Analysis · Tagged: gamma, mcgelligot, nomura

Mar 16 2021

Pre FOMC Nomura Gamma Update

midpoint of target range for federal funds rate 2023

From ZH: With less than 24 hours to go until one of the most closely watch Fed announcements in a long time, the VIX finds itself hanging just below 20, the gamma gravity in the S&P is at 4,000 while dealers remains short Nasdaq/QQQ gamma (which however is shrinking by the day). In short, depending […]

Written by SpotGamma · Categorized: Market Analysis · Tagged: gamma, mcgelligot, nomura

Dec 16 2020

TSLA into the S&P500

TSLA Spot Gamma chart of estimated notional gamma by strike, dropping sharply around 600 to 700.

In TSLA the largest gamma area was $600 heading into today. The stock traded down to $605 earlier this AM, $620 now. The largest volume & OI region is >=$650 44% of TSLA gamma exp on close of12/18, by which time ~$50bn of TSLA stock needs to be bought by S&P indexers

Written by SpotGamma · Categorized: Market Analysis, Stock · Tagged: expiration, gamma, S&P500, TSLA

Oct 02 2020

JPM Gamma Update

KALONIC gamma update jpm october 2020

We present updated gamma figures from JPM this morning. It syncs with our AM note that 3300 is the key level.

Written by SpotGamma · Categorized: Market Analysis · Tagged: gamma, JPM, Kolanovic

Aug 20 2020

Nomura August “Extreme Gamma”

From ZH As the Nasdaq goes from new record to new record high day after day, passively lifting AAPL to become the world’s first $2 trillion market capitalization company, something uncomfortable is happening under the hood. While the concentration of gainers in the Nasdaq has been well-discussed… There is an increasingly ominous major (bearish) divergence […]

Written by SpotGamma · Categorized: Market Analysis · Tagged: expiration, gamma, nomura

Aug 14 2020

ROKU Analysis 8/14/20

Line chart titled ROKU showing estimated notional put gamma in orange and call gamma in blue dropping near strike 150.

ROKU has an interesting setup day, as we show ~43% of options gamma is expiring today. Most of the options in ROKU are also at the 150 strike, which may setup an interesting “pin” play. The idea here is thats the options decay hedging flows (which are tied to 150) push the stock back towards […]

Written by tenten · Categorized: Market Analysis, Stock · Tagged: gamma, options expiration, ROKU

Aug 13 2020

FSLY Stock Analysis

Line chart of FSLY estimated notional gamma by strike with call and put gamma dropping near 80.

This was a great chart posted by our friend @ccurvetrading of FSLY stock based on our options data. You’ll note there was a lot of gamma put gamma set to expire today (8/13) which would be crushed if the stock started a move higher. This may have caused dealers to rapidly cover short hedges. We […]

Written by SpotGamma · Categorized: Market Analysis, Stock · Tagged: FSLY, gamma, hedge wall

Aug 12 2020

Gamma Level Resistance – A Visualization

ESU0 price chart with volume heatmap, yellow Combo L3 level at 3387, and red arrow indicating resistance.

Today provided an excellent example of key resistance at an important options level in the SPX/ES. As you can see the market had a consistent bid from the open right into our 3387 SPX level (yellow arrow, left). The market spend much of the afternoon up against that resistance area, and finally rejected it towards […]

Written by SpotGamma · Categorized: Market Analysis · Tagged: ES, gamma, support

Aug 11 2020

Silver SLV Gamma Volatility

Trade analysis table comparing call and put volumes, bid/ask trades, and delta ranges.

Silver and the SLV ETF are having some amazing volatility as of late, with a -10% move currently underway. We’ve been watching this setup for several weeks, anticipating volatility due to the large amount of call gamma building up. We believe its important to be aware of this position as these very large moves may […]

Written by SpotGamma · Categorized: Market Analysis, Stock · Tagged: gamma, silver, SLV

  • « Go to Previous Page
  • Go to page 1
  • Go to page 2
  • Go to page 3
  • Go to page 4
  • Interim pages omitted …
  • Go to page 6
  • Go to Next Page »

Primary Sidebar

SpotGamma-Subscriber-Signup-Banner

  • Hedging Against a Volatility Spike: VIX Calls vs. SPX Puts
  • September OPEX Options Positioning: Why 7,600 Is the Line | The OPEX Effect
  • S&P 500 Negative Gamma Below 7,600 — Brent Kochuba on tastylive
  • CPI Is the Catalyst. 7600 Is the Trade.
  • Trade Idea Generation Using Opening Setup
  • youtube
  • x
  • Privacy Policy
  • Disclaimer
  • Terms & Conditions
  • Support Center
  • Media
  • Contact Us

©2026 TenTen Capital LLC DBA SpotGamma

All SpotGamma materials, information, and presentations are for educational purposes only and should not be considered specific investment advice nor recommendations. Futures, foreign currency and options trading contains substantial risk and is not for every investor. An investor could potentially lose all or more than the initial investment. Risk capital is money that can be lost without jeopardizing one's financial security or lifestyle. Only risk capital should be used for trading and only those with sufficient risk capital should consider trading. Past performance is not necessarily indicative of future results. Testimonials appearing on this website may not be representative of other clients or customers and is not a guarantee of future performance or success.

View Full Risk Disclosure