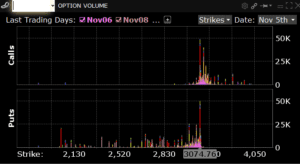
3075 dominated volume and $SPX closes 3074.77. Gamma forecast was range of ~15 handles on day. Here is an explainer on market gamma for those new to the concept.
gamma
Monitoring the Call Gamma Squeeze
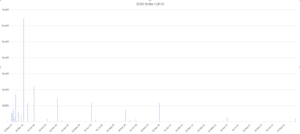
The idea has been that the roll-up of the 3050 calls to 3100 calls has caused a squeeze (see here) and that the 3100 strike currently holds the key to the next move in the SPX. November SPX expiration may help to get things moving – you can see in the chart below there is […]
Does Gamma Create Overnight Market Out-performance?
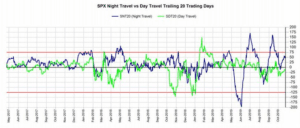
One of the working theories we’ve had is that the out performance of the S&P500 during the overnight session is due to market gamma. The idea is that options dealers gamma hedging keeps the market in check during cash sessions, and overnight the market can move about more. The chart below shows how much more […]
Why Market Gamma May Be Useful for Futures Traders
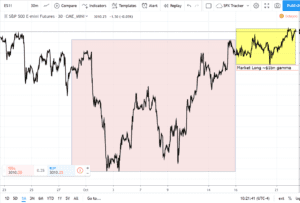
Here is a quick example to illustrate how market gamma may be useful for a futures trader. The last week SpotGamma has calculated a very large amount of gamma in the market, north of $1 billion. That predicts a tight, range-bound market. Below is a chart of the last month, the yellow box highlights a […]
Why Market Gamma Levels Matter
Here is a very low level primer as to what dealer gamma means and why those levels appear to influence the markets. There are many assumptions and oversimplifications made here. See our other articles and FAQ for more detailed information. Dealer gamma is a dollar value that estimates how much options dealer may have to […]
Gamma Effect Seen In Index Movement
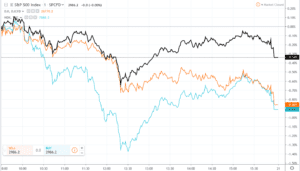
Lets classify this as what it is: speculation (at best) but its quite interesting on days like yesterday when the S&P is down only 34bps while Nasdaq and DOW were down ~90bps. Yes, Boeing (BA) hurt the DOW in particular but that wouldn’t explain the Nasdaq performance. The theory that should be bookmarked here is […]
How an Option Pin Plays Out
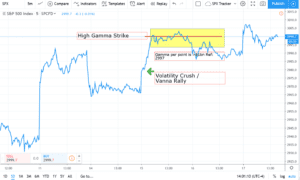
The current October options expiration portrays how an options pin can play out. For several days we have seen 3000 as our high gamma strike, with options volume at 3000 strike dominating the market. As the market moves away from this strike options dealers and other options hedgers move the price “back in line” to […]
Mid October Rally
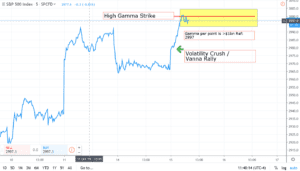
Here is a chart mapping out how we viewed this recent rally back up to 3000 in SPX, along with a bit of a prediction. The volatility crush sparked a rally today up to our “high gamma strike” of 3000. Because gamma is very high (~$1bn per S&P500 point) and 3000 is a high gamma […]
Nomuras Gamma View after the Rally
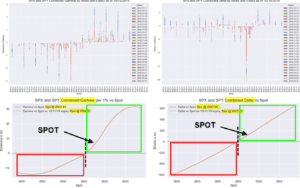
Via Heisenberg, here is Nomuras Gamma View after the Rally. They note the following: “[The SPX was ]gravitationally pulled higher (spot 2970) and now sits comfortably between the two large $Gamma upside strikes of 3000 ($3.7B) and 2950 ($2.5B)”…“As the bullish macro catalysts have indeed begun materializing, the various hedge expressions (VIX upside, S&P downside, […]
SPX Distribution vs Gamma Levels
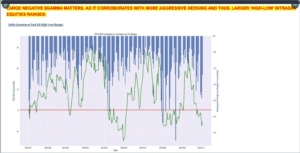
from Heisenberg: you can see when gamma is large and positive the market moves much less than when gamma is large and negative.