• Skip to main content
  • Skip to primary sidebar

SpotGamma™

S&P 500 Stock Market Gamma Trading Levels Based on Options Open Interest

  • About
  • Pricing
  • Academy
    • FREE TRADE PLANNING WEBINAR
  • Resources
    • Tool Demos
    • Case Studies
    • Blog
    • Support Center
    • Daily Report
    • Free Trading Tools
      • Opening Setup Free Report
      • Options Profit Calculator
      • SPX Gamma Exposure
      • Implied Earnings Moves
    • Report Card
  • Login

options skew

Aug 23 2026

Volatility Has Compressed. What Happens Next?

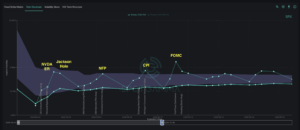
SPX term structure chart showing implied volatility declining from 32% to 10% across expiration dates through October 2026.

The S&P 500 pulled back slightly last week, and the market’s recent volatility compression phase appears ready for a reset. With earnings season largely over, both index and single stock volatility have dropped from the elevated levels that prevailed earlier this summer. Our pre-market Founder’s Note on Friday explained how substantial short-options positions cleared with […]

Written by Sherry An · Categorized: Market Analysis, SpotGamma Weekly · Tagged: contango, dealer gamma, forward implied volatility, Gamma Exposure, implied volatility, IWM put skew, Jackson Hole, Kevin Warsh, options positioning, options skew, QQQ call skew, spotgamma weekly, SPX term structure, synthetic gamma

Aug 16 2026

How Traders Can Play Low Volatility Environments
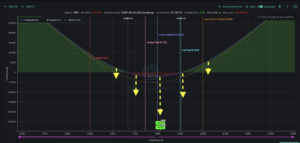
SPX options payoff diagram showing profit/loss curves with key strike levels and walls marked between $7,500-$8,000.

The S&P 500 has spent much of the summer grinding steadily higher to achieve record highs. Meanwhile, implied volatility has reset toward yearly lows for both major indices and many single stocks. When options become this cheap, the price of volatility itself can open new trading opportunities. The Term Structure chart reveals current SPX at-the-money […]

Written by Sherry An · Categorized: Market Analysis, SpotGamma Weekly · Tagged: call spreads, contango, dealer gamma, Gamma Exposure, implied volatility, long straddle, low implied volatility strategies, options convexity, options positioning, options skew, spotgamma weekly, SPX term structure, synthetic gamma, theta decay

Aug 09 2026

Welcome to the Summer Melt-Up

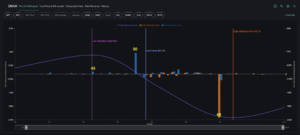
DRAM options gamma chart showing total gamma curve, call/put gamma bars, and volatility points at $45 and $61.5.

The S&P 500 delivered a high octane four-day run last week, establishing all-time highs with a 6% rise from weekly lows. Shifting interest rate expectations, easing Middle East tensions, and strong corporate earnings powered the dramatic rally. The sharp surge brought out notable divergences across the tech space. Software outperformed the broader market, with strong […]

Written by Sherry An · Categorized: Market Analysis, SpotGamma Weekly · Tagged: dealer gamma, dram ETF, dram options, Gamma Exposure, implied volatility, options positioning, options skew, realized volatility, SanDisk stock, semiconductor stocks, spotgamma weekly, synthetic gamma

  • « Go to Previous Page
  • Go to page 1
  • Go to page 2

Primary Sidebar

SpotGamma-Subscriber-Signup-Banner

  • Anthropic’s IPO: Could ANT Spark the Next AI Rally After OPEX?
  • Nvidia’s Lukewarm Reaction And The Flows Into Thanksgiving Week
  • Walmart Earnings Preview: Putting the Consumer to the Test
  • NVIDIA Earnings Preview: Can AI Growth Overcome the Leadership Shock?
  • The Market’s Rebound Fuel Runs Low
  • youtube
  • x
  • Privacy Policy
  • Disclaimer
  • Terms & Conditions
  • Support Center
  • Media
  • Contact Us

©2026 TenTen Capital LLC DBA SpotGamma

All SpotGamma materials, information, and presentations are for educational purposes only and should not be considered specific investment advice nor recommendations. Futures, foreign currency and options trading contains substantial risk and is not for every investor. An investor could potentially lose all or more than the initial investment. Risk capital is money that can be lost without jeopardizing one's financial security or lifestyle. Only risk capital should be used for trading and only those with sufficient risk capital should consider trading. Past performance is not necessarily indicative of future results. Testimonials appearing on this website may not be representative of other clients or customers and is not a guarantee of future performance or success.

View Full Risk Disclosure