In the presentation and outline posted below, SpotGamma presents a view that equity markets are experiencing dramatically low levels of volatility. The generally low levels of volatility are likely in response to both monetary & fiscal policy, globally, as low volatility is seen across many assets and regions. However, we believe that the impact of […]
Market Analysis
Meta Rips to $530 Then Reverses; SpotGamma Flow Signals Identify Both Sides of the Trade
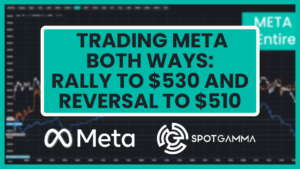
When Gamma levels shift higher and options flow aligns, markets can deliver powerful directional moves — and equally sharp reversals. Meta (META) offered a clean example of both in a single session, as bullish positioning drove a rally into liquidity before flow exhaustion marked the high of the day. SpotGamma tools highlighted a strong bullish […]
SpotGamma with Public: Semi Skews & the Stock Bubble
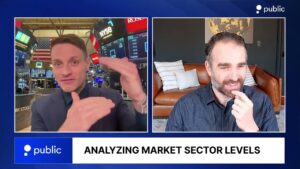
Brent Kochuba, Founder of SpotGamma, joined brokerage Public to discuss semi stock skews, and why he thinks stocks are in a bubble. However, that bubble may continue to expand – watch to find out why. Below is an automated transcript, please forgive any grammatical errors: Hey everyone welcome to Leading Indicator, a show bringing you […]
SpotGamma on TastyTrade: NVDA, 0DTE, VIX Exp & FOMC

Brent Kochuba, Founder of SpotGamma, joined Victor Jones & TastyTrade to discuss a variety of topics including:
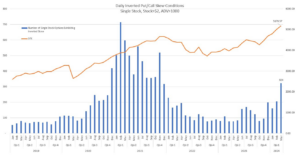
Systematic Call Overwriting In Action: QYLD
With all the attention on systematic options portfolios, here is a great view into what happens with $QYLD, the Nasdaq BuyWrite ETF ($8bn AUM). Each month they sell 1 month, ATM NDX calls against a stock portfolio. Call flow is shown via the orange line in our HIRO graphic, which essentially measures the delta of […]
March Call Demand & The Stock Market Bubble

SpotGamma Founder, Brent Kochuba, discusses the options landscape into a massive March Options expiration. Here they cover dispersion, correlation, option skew, and why these metrics point to a short term equity top.
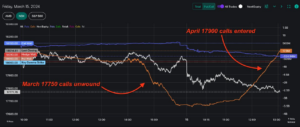
How SpotGamma Identified NVDA’s 900 Reversal — And Mapped the Entire Move Lower
This NVDA case study shows how a single level — the 900 Call Wall — set the stage for a high-probability intraday reversal, with SpotGamma tools mapping the move from resistance all the way down to key support levels. By combining positional analysis with real-time flow signals from HIRO, traders could anticipate both the breakdown […]
Why is the VIX So Low? Structured Products Offer an Answer

Equity market volatility (VIX) has been surprisingly low in 2023 despite uncertainty about interest rates and geopolitics. Some attribute this to the rise of short-term “zero-days-to-expiry” (0DTE) options trading. However, a recent article by the BIS argues that 0DTE trading is unlikely to be the main cause for low VIX and provides an alternative explanation: […]
Dispersion, Correlation, Volatility and the Stock Bubble

Dispersion readings are hitting highs per @SPGlobal, particularly in Mid Caps, while correlation is moving toward lows and volatility is flat. What does that mean? Why does it matter? High dispersion means individual components of an index are moving more than the whole, similar to the idea of market breadth. Traders have complained that the […]
The OPEX Effect: Feb Edition

SpotGamma Founder, Brent Kochuba, talks about the extreme call skews, and why that may lead to some stock price consolidation into the end of February.
