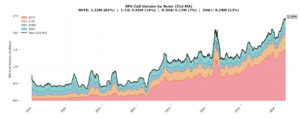
The S&P 500 has bounced back to record highs, closing decisively above 7,100 after Friday’s 1.2% rally. That marks a 12% rise from March lows in just under three weeks. In that same timeframe, volatility expectations have seemingly collapsed: VIX is down 40% since March 31, dropping from >30 to below 18. Crude oil has […]
Market Analysis
Vol Crush Lifts the S&P 500 — Will the Rally Last?
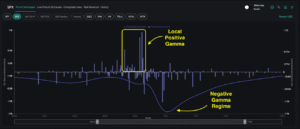
Following last week’s ceasefire announcement, the S&P 500 lifted 3% from roughly 6,550 to 6,800. On the surface, this rally looked like a meaningful shift toward risk-on sentiment as implied volatility collapsed rapidly across all expirations. Similarly, VIX plummeted below 20 for the first time in four weeks, marking one of its largest single-day declines ever. Yet […]
How One Key Level Drove Last Week’s Rally
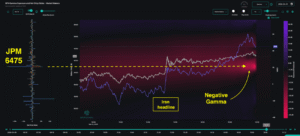
The S&P 500 bounced back 2% last week after scraping against 6-month lows. Mixed headlines on the Iran conflict explained much of this tug-of-war, yet markets are still holding their breath. For many traders, the rally felt counterintuitive: How can equities rally so furiously if geopolitical uncertainties remain unresolved? When looking at Tuesday’s major bounce in […]
GEX & JPM Collar: SpotGamma on TastyTrade

How Options Market Structure Controls Intraday Price Action: GEX, Dealer Hedging, and the JP Morgan Collar Trade Most traders watch price. Sophisticated traders watch flow. But the traders with real structural edge watch what dealers are forced to do — because when the biggest participants in the world’s largest options complex are compelled to hedge, markets move […]
The New Volatility Regime
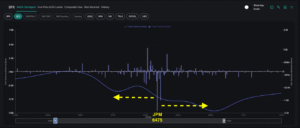
Over the past several weeks, we have consistently highlighted the market’s growing fragility. From the negative gamma “trapdoor” to the destabilizing impact of geopolitical shocks, the message has been clear: this is no longer a range-bound market. Last week confirmed those warnings, as the S&P 500 is down nearly 9% from all-time highs. On Thursday and Friday, traders […]
After OPEX: Market Loses Its Shock Absorber
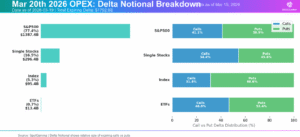
The options market has just cleared one of the largest structural events of the quarter, as Friday’s OPEX saw nearly $1.4 trillion in delta notional expire for the S&P 500. Because significant positions have now rolled off from the March expiration, the market has lost an important stabilizing force just as macro pressures begin to build. […]
VIX Expiration, Oil, and the JP Morgan Collar Trade: What’s Driving the S&P 500
Market Summary The market is entering a critical window where VIX expiration, quarterly options expiration, crude oil, and the JP Morgan collar trade are all colliding at once. The core argument is simple: implied volatility remains elevated while realized volatility has stayed unusually muted, and that mismatch may not last much longer. If oil continues […]
March OPEX: Tipping Point or Turning Point?
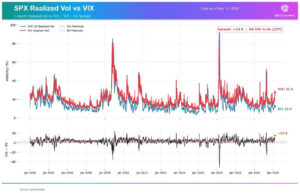
Fragility, Risk, and Potential Vol Reset As the S&P 500 enters OPEX week, we echo the same theme of the past few weeks: this market remains fragile. Last week’s selloff pushed the index below the three-month trading range of SPX 6,800-7,000 that had held since late 2025, subsequently closing down 5% since mid-January. The conflict with Iran continues […]
Geopolitical Risk Hits a Fragile Market
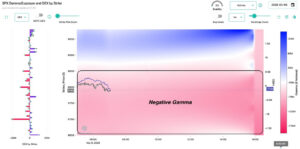
Markets entered last week on fragile footing. In our previous Sunday note, we emphasized how negative dealer gamma, extreme put skew, and heavy 0DTE options activity set the market up for a trapdoor scenario. This created a market structure vulnerable to sharp drops and spikes in volatility, as we saw play out last week. The dramatic […]
The Options Market Trapdoor
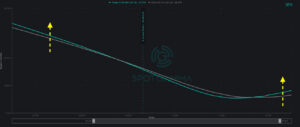
Over the past week, the topic of volatility has returned to the forefront. While the market has been largely range-bound, underlying support remains tenuous. Simultaneously, traders have begun more actively paying for downside protection. Given the backdrop of flaring geopolitical conflict, we see assymetric downside risk forming as trader uncertainty and negative gamma threaten to unlock the […]