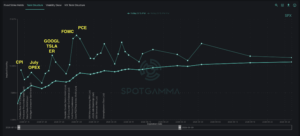
The S&P 500 spent early July grinding higher with sector rotation quietly forming beneath a calm index. As SPX price action remained relatively muted over the past week, implied volatility dropped to near-record lows as of Friday: IV for contracts expiring next week now sit in the 6-10% range. Regardless of any directional bias for […]
Market Analysis
Why Nasdaq Volatility Is Breaking Away from the S&P 500
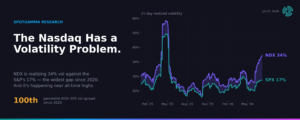
Key Takeaways We believe the options market is signaling something much larger than a temporary volatility anomaly. The Nasdaq itself has structurally changed in the past year, with its year-to-date performance +16% vs +9% for the S&P500. Concentration, AI exposure, new index methodology, and options positioning have transformed it into a meaningfully different investment than […]
Passing the Baton: From Semis to Software?
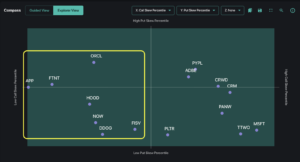
The AI trade has been the story of the first half of 2026, and semiconductors have been the main characters. The sector now accounts for roughly 20% of the entire S&P 500 — a historically high concentration. As we covered in our previous newsletter, any meaningful profit-taking in this area brings up the important question […]
July’s Setup: Rotation and Repositioning
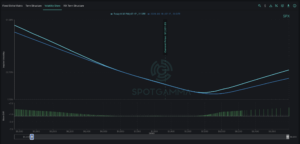
June lived up to its reputation as a volatile month with last week’s market drawdown. As we turn the page into July, the market now appears to be recalibrating positioning. Recent turbulence has driven capital rotation out of crowded tech leadership, and we now look for opportunities in alternative pockets of the market. In our […]
Korean Options Mania: How AI, Retail Leverage, and Memory Stocks Turned South Korea Into the World’s Most Volatile Market
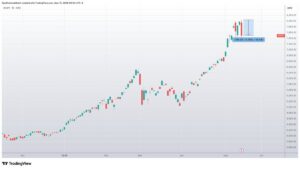
South Korea’s options trading mania in 2026 is driven by AI memory stocks, record retail leverage, ELWs, and extreme volatility in Samsung and SK Hynix. Here’s what’s fueling the surge and why it matters globally.
Vol Sellers Shrug off a Hawkish Fed
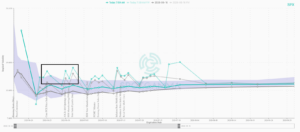
Despite a hawkish Fed rattling equities midweek, the market easily and quickly retraced any lost ground by Thursday. With June OPEX now behind us and implied volatility reset toward recent lows, there is a soft feeling of “what’s next?” for the S&P 500 until earnings season ramps up next month. The June FOMC meeting on […]
Triple Witching + FOMC Fuels Volatility Risk
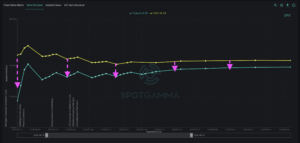
The market delivered several volatile sessions last week as traders navigated Wednesday’s CPI inflation report, Friday’s massive SpaceX IPO (SPCX), and a mix of Iran-driven headlines throughout. Last Sunday, we wrote about how extreme options positioning into major catalysts could spark the exact volatile market behavior observed over the past several days. Tuesday’s wild 200-point […]
The AI Trade Unwinds
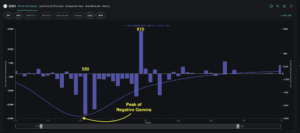
Wall Street’s historic weekly winning streak came to an abrupt halt last week. On Friday, a sharp NFP report drove the S&P 500 down over 2.6%, leading to a sharp AI selloff and rising bond yields. Adding fuel to the fire, the market now appears to be pricing in a rate hike by the end […]
Dispersion & Correlation are Screaming Overbought. Downside Hedging is Cheap.
CBOE’s Dispersion Index (DSPX) is at levels only seen during Covid and the April ’25 tariff crash, while Correlation (COR1M) is near all-time lows. This divergence signals extreme positioning risk driven by the AI stock chase, and makes SPY downside hedges historically cheap. Traders have been chasing AI related names in such heavy-handed fashion that […]
June Catalysts Threaten a Volatility Spasm — How Are Traders Positioning?
The S&P 500 has posted fresh record highs for the ninth straight week. Tech and semiconductor earnings fueled much of the recent surge, with SNOW climbing 52%, DELL gaining 57%, and MU surging 28% within one week. As we move into June, stretched positioning now meets a cluster of major catalysts. Three upcoming events will […]