• Skip to main content
  • Skip to primary sidebar

SpotGamma™

S&P 500 Stock Market Gamma Trading Levels Based on Options Open Interest

  • About
  • Pricing
  • Academy
  • Resources
    • Tool Demos
    • Case Studies
    • Blog
    • Support Center
    • Daily Report
    • Free Trading Tools
      • Opening Setup Free Report
      • Options Profit Calculator
      • SPX Gamma Exposure
      • Implied Earnings Moves
    • Free Training
    • Report Card
  • Login

Market Analysis

Sep 07 2025

The Record-Setting 0DTE Showdown

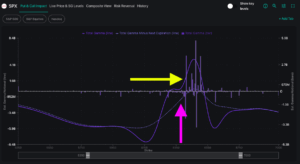
SPX gamma chart with total gamma lines and bars by strike from 5350 to 7000, yellow and pink arrows at peak and dip near 6400.

The S&P 500 delivered a volatile week: Tuesday began with risk-off positioning and a negative gamma environment, evolving into Thursday’s explosive rally, finally culminating in Friday’s blowoff top. The result? SPX closed almost exactly where it started the week at 6,482. By Wednesday, 0DTE options hit a record-setting 70% of all options volume, keeping the market […]

Written by Simon Scholten · Categorized: Market Analysis, SpotGamma Weekly

Sep 01 2025

Low Volatility Keeps S&P 500 in a Fragile Calm
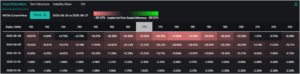
NVDA color-coded matrix of implied vol differences by strike and expiry from Aug 28 versus 27, current price 174.13.

This week saw the zombie market resume with suppressed volatility and a broader market remaining constrained by positive gamma. SPX closed the week at 6,460, grinding slightly higher throughout the week before the rug was pulled on Friday. NVIDIA earnings on Wednesday served as the pivotal moment that shaped both volatility patterns and the broader […]

Written by Simon Scholten · Categorized: Market Analysis, SpotGamma Weekly

Aug 24 2025

The “Zombie Market” vs. NVDA Earnings

SPX total gamma line and bar chart versus option strikes from 6190 to 6705 highlighting the 6400 strike.

The sell-off last week exemplified a classic post-OPEX window of weakness, reinforced by Wednesday’s VIX expiration. With structural support somewhat removed, the market experienced a measured four-day decline from 6,455 to 6,345. Then, Powell’s Jackson Hole speech on Friday delivered exactly the dovish tone markets were hoping for, triggering a sharp reversal that saw the […]

Written by Simon Scholten · Categorized: Market Analysis, SpotGamma Weekly

Aug 17 2025

Volatility Drought Persists Through OPEX
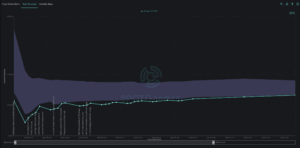
Line chart of SPX implied volatility term structure from Aug to Oct 2025 with teal line, purple shade, and labeled events.

SPX ended the week at a major SpotGamma support level of 6,450, driven by a combination of volatility compression, stabilizing dealer hedging flows, and the power of large options positioning. This week followed the trajectory outlined in our Founder’s Note on Monday morning: a benign CPI reading sent volatility even lower, and the SPX rose from 6,360 […]

Written by Simon Scholten · Categorized: Market Analysis, SpotGamma Weekly

Aug 10 2025

Market Drifts Through “Death Valley” Vols
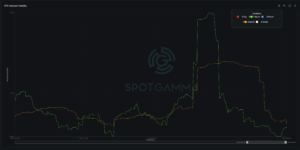
Line chart of SPX realized volatility with 1-month green and 3-month orange lines from 2024 to 2025 showing a large spike.

The S&P 500 delivered a week that looked dramatic at times, but ended up just drifting slightly — closing up 1.8% after a wild ride. While volatility spiked early in the week from tariff deadlines and semiconductor earnings disappointments, IV quickly collapsed as 0DTE flows reasserted control. This vol crush became a self-reinforcing tailwind for […]

Written by Simon Scholten · Categorized: Market Analysis, SpotGamma Weekly

Aug 03 2025

From “Zombie Market” to Vol Awakening

SPX total gamma chart plots bars and a line versus strike prices, noting last close 6339, low volatility 6380 and high 6600.

What a difference a week makes. The S&P 500 went from consistently hitting all-time highs with 6,450 touched on Wednesday to close Friday down 1.6% to 6,238.This dramatic shift from “zombie market” to spiking realized volatility exemplifies the need for protective puts and/or VIX calls as insurance, as we highlighted in the daily pre-market Founder’s Notes throughout […]

Written by Simon Scholten · Categorized: Market Analysis, SpotGamma Weekly

Jul 27 2025

Animal Spirits Roar as Market Catalysts Loom

Compass scatter chart plotting tickers by IV Rank and Risk Reversal Rank, yellow box on top-right quadrant.

This week delivered a fascinating mix of meme stock chaos, trade deal optimism, and mega tech earnings keeping traders on their toes despite unusually calm waters for the broader market. The S&P 500 ultimately gained ground, closing at all-time-highs, just below the pivotal SPX 6,400 gamma strike. Call option volumes exploded this week alongside broader […]

Written by Simon Scholten · Categorized: Market Analysis, SpotGamma Weekly

Jul 20 2025

July OPEX Opens the Window of Weakness
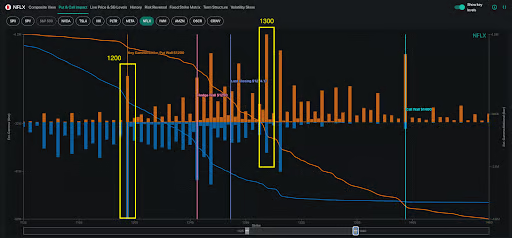
This week delivered everything from mini-flash crashes to meme stock explosions, capped off with a July OPEX that reinforced our thesis about dangerously complacent volatility expectations. Our key levels proved their worth again this week: resistance at 6,325 limited upside attempts, and support zones at 6,250 and 6,200 provided reliable bounce points. The 6,200 pivot […]

Written by SpotGamma · Categorized: Market Analysis, SpotGamma Weekly

May 15 2025

Put-Covering Rallies & Signals in Our SPY Gamma Exposure (GEX)
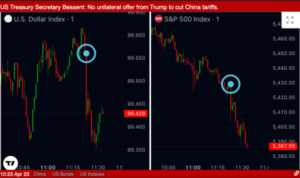
Two candlestick charts of U.S. Dollar Index at 99.429 and S&P 500 Index at 5,387 with Bessent China tariffs headline.

The big question: Was that rally all put covering? Signals in SpotGamma’s custom SPY GEX say “Yes” This week the S&P500 rallied ~3% to close the Liberation Day downside price gap (red horizontal line). This led the S&P500 to notch a 9-day win streak – the longest such streak since November 2004. With that, the VIX […]

Written by SpotGamma · Categorized: Market Analysis · Tagged: market analysis, market makers, options flows, put calls, put rallies, SPX

May 13 2025

The Anatomy of an SPX 0DTE Driven Market
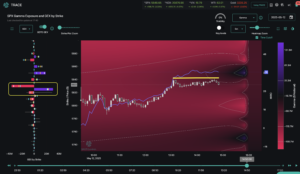
TRACE 0DTE Options

U.S. equities surged on May 12, 2025, as the S&P 500 closed +3% to 5,848, with intraday action reflecting a more modest 0.23% gain, after the U.S. and China agreed to a significant 90-day reduction in reciprocal tariffs. What did any of this have to do with 0DTE SPX options? Hint: The 0.23% intraday gain. The Anatomy […]

Written by SpotGamma · Categorized: Market Analysis · Tagged: 0DTE, cboe, SPX

  • « Go to Previous Page
  • Go to page 1
  • Interim pages omitted …
  • Go to page 14
  • Go to page 15
  • Go to page 16
  • Go to page 17
  • Go to page 18
  • Interim pages omitted …
  • Go to page 69
  • Go to Next Page »

Primary Sidebar

SpotGamma-Subscriber-Signup-Banner

  • Right-Tail Risk On CNBC: The Larger Moves Have Come To The Upside
  • CYTK: A $390K Options Bet Targets November FDA Catalyst
  • Why Option Premiums Look Too Thin To Sell
  • CPI Meets Positive Gamma: The SPX Levels That Could Determine the Next Move
  • The OPEX Effect: Put Selling Is Still Doing The Work
  • youtube
  • x
  • Privacy Policy
  • Disclaimer
  • Terms & Conditions
  • Support Center
  • Media
  • Contact Us

©2026 TenTen Capital LLC DBA SpotGamma

All SpotGamma materials, information, and presentations are for educational purposes only and should not be considered specific investment advice nor recommendations. Futures, foreign currency and options trading contains substantial risk and is not for every investor. An investor could potentially lose all or more than the initial investment. Risk capital is money that can be lost without jeopardizing one's financial security or lifestyle. Only risk capital should be used for trading and only those with sufficient risk capital should consider trading. Past performance is not necessarily indicative of future results. Testimonials appearing on this website may not be representative of other clients or customers and is not a guarantee of future performance or success.

View Full Risk Disclosure